Before talking about EPA rules and the loss of the coal-fired power plants as an electricity source, I first will survey the longer term trend for Texas

For simplicity, I lumped Natural Gas (CH4) and Other Gases (mostly propane) together. “Other Renewables” includes wind, solar (thermal & PV), geothermal sources and biogenic municipal solid waste, wood, landfill gas, etc... “Other” includes non-biogenic municipal solid waste, batteries, chemicals, hydrogen, pitch, purchased steam, sulfur, tire-derived fuels and miscellaneous technologies.
As you can see, the relative contributions from coal have gone down from 43% in 1990 to 36% in 2010, Natural Gas has also gone down from 51% in 2000 to 46% in 2010. Nuclear (mostly in the early 1990s) and Other Renewables (mostly in the 2000s) have proportionally gone up. A good portion of the Other Renewables likely corresponds to wind-derived electrical power, which has been a major focus of growth in Texas Texas passed California in 2006 as the largest wind energy producer in the USA
On its face, Texas
One more point about resilience. Texas

At 93% Kentucky Kentucky Louisiana has some spare natural gas derived electricity it could sell Kentucky Kentucky and Louisiana both already has a net electricity interstate trade deficit: Kentucky since 2007 and Louisiana Louisiana Hawaii Hawaii
Alright, enough of the state-upmanship. I thought that showing Figure 5-6 would give a sense of how much electricity sources can vary from state-to-state, and therefore why rules impacting one or two electricity sources (e.g., coal, and to a lesser extent gas and oil) can have a much bigger effect on some states than other states. For instance, because Idaho, Washington Oregon and California state legislatures effectively have banned new coal-fired plants, and in the case of California, prohibited utilities from entering into long-term contracts with coal-fired power plants for electricity imports, the EPA rules summarized below may not have much impact on these states. I suppose that Idaho, Oregon and Washington can afford to do this because they get 60-80% of their power from hydroelectric power sources; not surprisingly, California only get 1% of its electricity from coal.
Even though coal is not THE major electricity power source for Texas, it is a very important source, and, the losses from that source, coupled with Texas’s growing electricity use and isolated grid, is what is creating the predicament.
New EPA rules aimed at reducing air pollution
The Cross-State Air Pollution Rule (CSAPR)
Ostensibly, CSAPR was enacted to ensure state compliance with the Clean Air Act and in particular SO2, NOx and Ozone levels:
CSAPR requires a total of 28 states to reduce annual SO2 emissions, annual NOX emissions and/or ozone season NOX emissions to assist in attaining the 1997 ozone and fine particle and 2006 fine particle National Ambient Air Quality Standards (NAAQS). from EPA’s Cross-State Air Pollution Rule (CSAPR)
According to the EPA, implementing CSAPR will prevent tens-of-thousands of deaths and hundreds-of-thousands of illnesses, thereby by yielding $120 to $280 billion in annual health and environmental benefits in 2014, while only costing $800 million annually (see Cross-State Air Pollution Rule (CSAPR)). Incidentally, this rule will also reduce CO2 emissions, without the EPA having to overtly regulate CO2 emissions under the Clean Air Act (see e.g., Is Obama's EPA trying to implement 'backdoor cap-and-trade'? Um, no).
On January 17, 2012, the U.S. District Court of Appeals of DC stayed CSAPR and will hear the Appeal in April 2012 ( see also EPA, challengers spar over court review of cross-state rule).
Mercury and Air Toxics Standards (MATS)
The EPA recently finalized the Mercury and Air Toxics Standards (MATS), under the authority of the Clean Air Act. MATS will cover 1,400 coal and oil-fired electric generating units (EGUs) at 600 power plants by setting national standards for all Hazardous Air Pollutants (e.g., mercury, acid gases, non-mercury metals, dioxins, SO2) emitted by coal- and oil-fired plants with a capacity of 25 MW or more. Incidentally, CO2 is considered an acid gas. The plants covered by MATS will have 4 years to comply. I have little doubt that MATS will also be challenged and litigated in the Courts.
Cooling water intake structures: section 316(b) rule
Under the authority of the Clean Water Act, the EPA’s Section 316(b) Rule will enforce standards to control the location, design, construction and capacity of cooling water intake structures designed to use cooling water from various bodies of water (lake, river, etc...) to cool plants, including electric power plants and petroleum refiners. These cooling structures must “reflect the best technology available (BTA) for minimizing adverse environmental impact” and the goal is to reduce the mortality to fish, eggs, larvae and other aquatic organisms that come in contact with the cooling water intake (see how 316(b) could impact your power plant). Phase I rules, effecting new plants, went into effect in 2001. The Phase II rules, to regulate existing power plants, were proposed in 2004 and suspended in 2007 pursuant to law suits filed to suspend the rule because the BTA standard was not clear, which the Second Circuit Court of Appeals granted in part. A final version of the Phase II rule is planned for July 2012 with the rule taking effect soon afterwards. Under the final rule, compliance with the BTA standard will likely involve the installation of cooling towers, dry cooling technology or additional intake cells to lower water velocity. Compliance with the 316(b) requirements will be concurrent with the renewal of each facility's National Pollutant Discharge Elimination System (NPDES) permit which expires every 5 years (see how 316(b) could impact your power plant).
Coal Combustion Residuals Rule (CCRR)
The Coal Combustion Residual Rule (CCRR) is another rule proposed by the EPA, “to regulate for the first time coal ash to address the risks from the disposal of the wastes generated by electric utilities and independent power producers.” The EPA takes its authority to make the CCRR under the Resource Conservation and Recovery Act (RCRA), enacted in 1976, and intended to cover the disposal of disposal of solid waste and hazardous waste.
Coal fly ash, is residue from the combustion of coal in power plants and captured by pollution control technologies, like scrubbers. But pollution from coal ash CCRs can leach into the ground water if/when impoundment structures holding the coal ash fail. The EPA points to the contamination of 300 acres of land and rivers with CCRs in December 2008 as an example of what can happen when a CCR impoundment structure failed near Kingston, TN (see e.g., TVA Coal Ash Disaster Dec 22 2008; Aerial Footage of Retaining Wall Failure; Months after ash spill, Tennessee town still choking).
Greenhouse Gas Regulations
The EPA has already started to regulate greenhouse gas (GHG) emissions from power plants, in the form of issuing a green-house gas permits to a natural gas-fired power plant in Texas, with ten additional Greenhouse Gas permit applications for Texas companies under review (see also U.S. Starts National CO2 Permits, Cap and Trade Works, and Other Surprises). This follows from a December 15, 2009 EPA finding that greenhouse gases threaten human health and welfare by causing, or contributing to, climate change. Because GHGs are “air pollutants,” they are covered by the Clean Air Act and therefore, GHGs fall within the EPA’s jurisdiction. As such, the EPA can broadly regulate the substances in the air we breathe. Water vapor, carbon dioxide, methane, nitrous oxides (NOx) and ozone are all green house gases, as are fluorocarbons, and various gaseous fluorides emitted from motor vehicles or power plants. EPA regulation includes issuing, or not issuing, permits to power generating plants, or, setting emission standards for vehicles, based on their green house gas emission impact.
The EPA is issuing the permits in Texas because the State of Texas Texas , filed petitions opposing the finding and requested a review of the finding by the Circuit Court of Appeals for the District of Columbia Texas
Impact of the new EPA rules on Coal-Fired Plants
Some see the Cross-State Air Pollution Rule (CSAPR, pronounced “casper ”), like the other rules summarized below, as part of a backdoor institution of a CO2 Cap-and-trade program in the USA
For instance, the Energy Research Institute (ERI) rhetorically asks: since many air pollutant levels have gone down over the past decade anyway, why are yet more rules needed (see Electric Grid Reliability Problems: The Result of EPA Regulations?). The ERI’s implication is that a number of the rules directed to reducing pollution are being used to indirectly reduce CO2 emissions. If the EPA’s ability to implement GHG Regulations are ratified by the Courts, then this indirect approach would not be necessary. However, CSAPR, MATS, 316(b) and CCRR would be strong fall-back positions that would have essentially the same effect as direct regulation of GHGs from coal-fired power plants.
Regardless of their merits, possible hidden agendas etc..., if all of these rules go into effect it will cause some utilities operating coal-fired power plants to either install costly technology and equipment to comply with standards under the rules, or, shut down the plants where it would be too cost-prohibitive to retrofit with anti-pollution measures. I imagine that in the former case, the cost of retrofits will simply be passed on to customers, and that latter case would apply mainly to older, smaller, plants where it would take too long to recover the retrofit cost. Alternatively, utilities could just decide to reduce their use of coal-fired plants up to their annual pollution limits, and then just idle the plant thereafter.
At best, the EPA rules will give the effected States reduced costs because of less sickness and death due to cleaner air and water, but likely at the cost of higher electricity prices. At worst, the EPA rules will have little effect heath, because air pollution would go down anyways, cause increase electricity prices and cause the number of rolling blackouts to increase.
For Texas
Estimating of Texas
EPA Assistant Administrator Gina McCarthy has said she's confident the agency's rules won't cause electric reliability problems and will provide health benefits that far outweigh the costs. She said Thursday the Clean Air Act has mechanisms the agency has used for 40 years to protect localized reliability.
"We make sure that the lights stay on, and we achieve compliance as soon as we can," McCarthy said by telephone.
from Texas power grid operator says blackouts possible, Dec 1, 2011
Of course, the EPA’s position is that these rules will have no effect on the reliability of electricity supplied to Texans and that Texas
However ERCOT’s Warren Lasher has pointed pointed out how the EPA has grossly over-estimated Texas
The expected maximum generating capacity in the ERCOT region in 2014 is 75,967 MW. Background documentation for the CSAPR provided by the EPA3 indicates that their projection for the operational capacity in 2014 in ERCOT is 90,405 MW, a discrepancy of 14,438 MW.
Based on an assessment of the EPA Integrated Planning Model (IPM) input database which was used by the EPA to analyze the expected impacts of the CSAPR, ERCOT believes that this discrepancy is the result of the inclusion of wind generation resources at their full name-plate capacity, and the inclusion of retired and mothballed generating capacity. ERCOT currently has approximately 9,452 MW of wind generation capacity connected to the grid. In the latest CDR, this wind generation capacity has an ELCC of 822 MW (8.7% of nameplate capacity). The discrepancy which would result from the use of the full nameplate capacity of wind versus the use of the current ELCC of wind is 8,720 MW.
Declaration of Warren P Lasher September 21, 2011 (my emphasis added)
Well, if the EPA is including retired and mothballed plants (corresponding to 5,784 and 2,644 MW of capacity, respectively, according to Lasher), then that’s just plain wrong on their part. But the point Lasher makes about wind deserves some further consideration.
Texas's electricity generation capacity from wind
Wind, of course, is variable and in

This data correspond to the first week in August 2011, when Texas
Notice the order-of magnitude different scales for total electricity demand (green) and wind-derived electricity (blue). But what little electricity the wind did produce during these days, it was in the middle of night or early morning and not in the middle of the afternoon when demand was maximum (corresponding to the vertical dashed lines that I added). That’s in part why Lasher comes up with an effective load carrying capability (ELCC) of only 8.7% of name plate. In other words, even if there is 9,452 MW of wind generation capacity connected to the grid, you should only expect about 822 MW to be available at any given time. For instance, from Bryce’s chart, on August 3, 2011 when Texas
It turns out then, in Revisiting Rolling Blackouts in Texas I grossly overestimated wind’s ability to provide power at the time it was needed most as being 22% of nameplate capacity—a 2.5 times (i.e., 22/8.7) over-estimate. Adding more wind capacity now seems to be an even less efficient solution to Texas Texas
Assessing the number plants retiring and the loss of electrical generating capacity
According to the IER, there is wide disagreement about the number of plants that will be shutdown and the amount of electricity generation capacity that will be lost due to the implementation of the first two rules, CSAPR and MATS.

The discrepancies between the EPA’s, NERC’s (North American Reliability Corporation’s) and Department of Energy’s (DOE) models for capcity loss are mainly due to their differing estimates of the numbers of plants that will be retired. The IER gets a 15,364 MW higher estimate than the EPA by including operator announcements of closures that are not counted by the EPA. I guess that if the EPA modeling doesn’t say that a plant will close, then the EPA doesn’t count it, even if the plant says that it will close. After reading Warren Lasher’s comments about how the EPA includes retired and mothballed plants in their estimates of Texas
The full IER document spells out, state-by-state, the plants that the EPA predicts will be retired and plus the additional announced retirements. Here is the data for Texas

Based on these numbers, it appears that the EPA estimates a loss of 928 MW of capacity by 2015, while the IER estimates that a total of 2542 MW capacity will be lost by 2015. For instance, the EIA doesn’t include the 1186 MW in lost capacity in 2012 due to the idling of two Monticello coal fired plants in Titus Tx, as announcement by Luminant Energy (see e.g., Texas power grid operator says blackouts possible). At 1186 MW, those two Monticello plants could generate nearly 2/3 of all the power that the entirety of Texas
Some Rolling Blackout Scenarios for Texas
On August 3, 2011, the ERCOT region set a new peak demand record of 68,294 MW, breaking the record set in 2010 of 65,776 MW. The online capacity available for the ERCOT region on August 3, 2011 was 69,504 MW, meaning that total available generating capacity exceeded demand by only 1,210 MW, or less than 2%. Had the grid experienced forced outages of additional units, ERCOT might have had to employ rotating outages. The very next day, on August 4, 2011, in order to avert rotating outages, ERCOT had to deploy its Emergency Interruptible Load Service ("ElLS"), which is an emergency load reduction service that involves disconnecting large customers that voluntarily agree to have their service interrupted in an electric grid emergency. If another 300-500 MWs of generating capacity had been unavailable on August 4, 2011, ERCOT would have had to order rotating outages to maintain grid reliability.
Declaration of Warren P Lasher September 21, 2011 (my emphasis added)
That 69,504 MW capacity is lower than Texas
An additional useful piece of information is ERCOT’s published guidelines for levels of Energy Emergency Alert Communications:

As you can see, through contracted agreements with large industries and procuring power from Emergency Interruptible Load Services from outside of the grid, ERCOT has about 1400 MW of capacity to stave off rotating black out. This gets instituted when capacity is less than 1750 MW above demand. If capacity still exceed that 1400 MW, then when capacity is less than 350 MW (i.e., 1750-1400) above demand, rotating blackouts start.
With this information in hand, I decided to replay the summer months of 2011, but with various assumptions made about Texas’s electricity generating capacity and demand going forward.
The data set to run my scenarios is the actual daily hourly electricity demand for Texas,
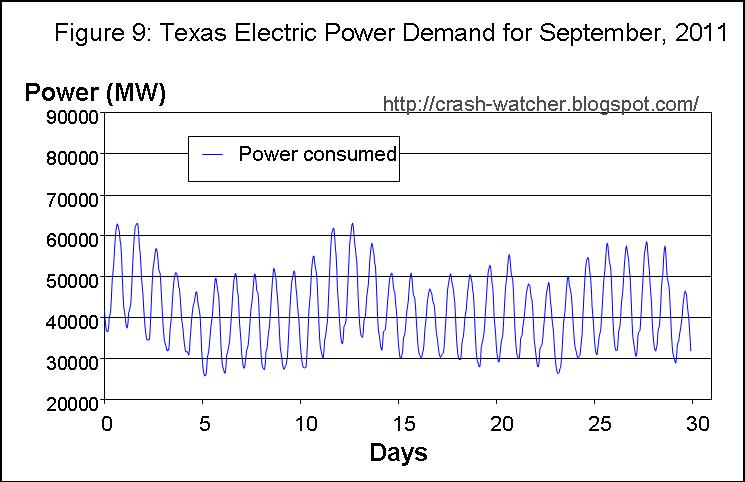
Figures 7, 8 and 9 present the ERCOT reported power demand data for the months of July August and September, respectively.


Scenario 1:
Based on Lasher’s declaration and the published ERCOT emergency levels, I will assume an electricity generation capacity throughout these three months of 69,504 MW minus the 1,186 MW in lost capacity from the two Monticello
Figure 10 shows August 2011 under this scenario:

There are a total of 12 days, mostly Monday thorough Wednesday, that reach Level 2, with industry shedding and emergency services instituted and 1 day of these 12 days, August 3rd, reaches Level 3 conditions, with general rolling black out. Neither July nor September reaches a Level 2 situation.
Scenario 2:
In Scenario 2, I made the same assumptions as Scenario 1, but with the assumption that electricity demand goes up in 2012 by 2% compared to 2011. I think that this is quite reasonable given Texas
Figure 11 shows August 2011 under this more realistic scenario (once again neither July nor September reaches Level 2):

Under this scenario we have 17 days, over half of all the weekdays, reaching Level 2, and, 11 days of those 17 days also reaching Level 3.
Scenario 3:
In Scenario 3, I made the same assumptions as in Scenario 1, including assuming the same levels of electricity demand, except that I will assume an electricity generation capacity throughout these three months of 69,504 minus the 2,542 MW capacity that the IER estimates to be lost by 2015. That might approximate the situation by 2015, again assuming no increase in demand. Under this mild scenario, ERCOT would have 66,962 MW of power capacity. As before, when capacity is less than 1750 MW above demand (i.e., Level 2, demand reaches 65,212 MW; orange line) I assume that industry load shedding of emergency services would start and when capacity is less than 350 MW above demand (i.e., Level 3, demand reaches 66,612 MW; red line) I assume that rotating blackout would start.
Figure 12 shows August 2011 under this scenario (once again neither July nor September reaches Level 2):

Under this scenario the number of days reaching Level 2 and 3 are very similar to Scenario 2: 18 days reaching Level 2, and 11 days of the 18 days also reaching Level 3.
Scenario 4
This scenario combines Scenarios 2 and 3; I assume a 2% per year growth in power demand out to 2015 as compare to the 2011 demand (i.e., (1.02)4=1.082) and I also assumed the 2,542 MW capacity loss estimated from the IER report.
Under this more realistic scenario, there are days in all three months that reach Level 2 and 3; Figure 13-15 shows these three months under this scenario:


Things look quite grim under Scenario 4. Level 2 is reached on 21 days, 29 days and 4 days for July, August and September, respectively, for a total of 54 days out of a possible 92 days. Level 3 is reached on 17 days, 28 days, and 4 days for July, August and September, respectively, for a total of 49 days.
Only three days in August do not have at least Level 2 conditions. And, it is not just the number of days with Level 2 or 3 conditions, it is the duration of these conditions during each day. For instance, during that record day, August 3, 2011, the Level 3 condition extends from 1 pm to 9 pm. Most of the other days during August similarly have extended periods of Level 3 conditions, ranging from 1-3 pm to 6-7 pm each day.
Only three days in August do not have at least Level 2 conditions. And, it is not just the number of days with Level 2 or 3 conditions, it is the duration of these conditions during each day. For instance, during that record day, August 3, 2011, the Level 3 condition extends from 1 pm to 9 pm. Most of the other days during August similarly have extended periods of Level 3 conditions, ranging from 1-3 pm to 6-7 pm each day.
I think that I will stop here, but keep in mind that I did not consider the possibility that the other EPA rules like, 316(b), CCR, or the GHG regulations would cause more plant closures, of that there could be more closures past 2015. These rules could be significant, however.
For instance NERC’s 2011 Long-Term Reliability Assessment (p.117-118) indicates that of the fours rules, CSAPR, MATS, CCR and 316(b), it is 316(b) that could have the biggest effect on reducing electricity reserve margins: an additional 25,000-30,000 MW nationwide, but not until 2018. NERC estimates that CSAPR and MATS could further reduce margins by another 4,000 MW and 8,000-12000, respectively, by 2018. It is not clear how much of these additional losses would apply to Texas
Scenarios Summary
Based on the EPA estimates of closures and owner-announced plant closures, there is a good chance of rolling blackouts becoming an annual problem during the summer in Texas.
For 2012, I assumed the owner-announced shut down of 1,186 MW worth of power from two coal-fired plants in the ERCOT area of Texas Texas
For 2015, I assumed EPA-estimated or owner-announced shut downs of 8 coal-fired plants amounting to 2,642 MW of power will occur. If Texas
If, however, power demand goes up by 2% per year, each year till 2015, and the 8 coal-fired plants shut down, then the numbers of Level 2 and 3 days and the length of these emergency conditions during each day becomes much more wide-spread. Level 2 conditions for 54 days out of a possible 92 days, and, Level 3 conditions for 49 days, during July, August and September, and lasting for several hours each day at least during August.
Well, this has blown up into another long post, so I will save my comments and conclusions, and some additional broader analysis, for what will be the third and final installment of this series.
I hope that you will join me then.
I hope that you will join me then.
Very interesting, CW. Rolling blackouts and electrical grid breakdowns are something those of us in the peak oil community have been expecting for awhile now. This is the first technical analysis I've seen which explains WHEN that might actually start to happen.
ReplyDelete“Other” includes ... batteries
ReplyDeleteSince when did batteries become an energy source?
Thanks Bill, however, the rolling blackout scenario that I outline is not caused by, or have anything directly to do with peak oil, or even resource depletion per se. I'll talk more about this a little bit in part 3.
ReplyDeleteVery good point, VIYH, although that is one of the elements the EIA lists under "Other." Of course, batteries are a way of STORING energy for later use, but are not a SOURCE of energy in themselves. In any event, for all of the State Electricity Profiles that I looked at, the total of "Other" was always less than 1% or was not even listed, which I took to mean trace amounts.
This comment has been removed by the author.
ReplyDeleteThank you for your post. This is excellent information. It is amazing and wonderful to visit your site.
ReplyDeleteroad spike systems in delhi
revolving glass turnstiles in delhi
drop arm turnstiles in delhi
boom barriers in delhi
road spike system in chennai
road spike systems in chennai
revolving glass turnstiles in chennai
drop arm turnstiles in chennai
Thank you for your post. This is excellent information. It is amazing and wonderful to visit your site.
ReplyDeleteautomatic bollards
road spike system in mumbai
revolving glass turnstiles in mumbai
turnstile Systems in mumbai
electromagnetic locks manufacturers in mumbai
electromagnetic locks suppliers in mumbai
boom barriers manufacturers in mumbai
boom barriers suppliers in mumbai
tripod turnstile suppliers in mumbai