Recap
In Part 7, I examined the relationship between increasing global population and global petroleum production rates and found that they have a very strong linear correlation.
Based on this correlation, and suggestions that the Green Revolution in food production and delivery was made possible by petroleum consumption, I hypothesized that the increase in petroleum production was the cause of the increase in population. I further hypothesized that, because petroleum exports and production are likely to continue to decline in the near future (Part 5 and Part 6), there could be an immediate decline in population that follows the previous correlation between increasing global population and global petroleum production rates, but in reverse. An alternative hypothesis I posed was that global population will continue to increase, even in the face of declining petroleum consumption, possibly through further gains in the efficiency of the food production system.
In Part 8, I looked for evidence of declining population during past periods when petroleum consumption rates declined, either globally or one of the seven regions that have been the focus of this series: the Middle East, ME; Former Soviet Union, FS; Africa, AF; South America, SA; Asia-Pacific, AP; Europe, EU and North America, NA. I did not find evidence to support the scenario predicting an immediate decline in population as petroleum consumption declines.
At the end of Part 8, I suggested a possible reason why the population had not fallen during previous periods of regional petroleum rate consumption decline: despite the decline in consumption, the per capita petroleum consumption rate levels were still more than adequate to support the food production system.
Here in Part 9, I first estimate how much petroleum consumption per capita is needed to sustain the food production system as we know it. Then, I look for evidence to support or refute my idea that the population, or at least population growth, will decline once the per capita petroleum consumption goes below the critical level.
Hold on to your hats, this is going to be a bumpy ride.....
How much petroleum consumption per capita is needed to sustain the food production system?
There are some previous studies that have tried to estimate fuel or energy inputs into the food production and distribution system in the USA. One issue I have with these studies is that they do not try and sort out where the energy comes from, and in particular, how much of the energy could be supplied from the same barrel of oil.
For example, let’s say a gallon of distillate fuel oil (dfo or diesel fuel) is used by a farmer to operate the equipment to prepare his field, plant the crops, and harvest the crops. The farmer also spray petroleum-based pesticide and fertilizer on his crops. The food gets transported to to markets in dfo powered vehicles. The harvested food gets packaged in petroleum-based plastic film. Household then use gasoline to drive to the market to buy the food. My contention is that the same barrel of oil could be used to produce much, or all, of the dfo, the pesticide and fertilizer, the plastic wrap and the gasoline used in this food system.
To see why, take a look at this summary table of what one barrel of oil produces:
Figures are based on 1995 average yields for |
These and other categories of petroleum refinery produces are defined in further detail here.
Okay with that background, let's look at some previous estimates of energy inputs into the food production.
Farm uses of Petroleum
Efficiency gains can help reduce agriculture’s dependence on oil. In the United States, the combined direct use of gasoline and diesel fuel in farming fell from its historical high of 7.7 billion gallons (29.1 billion liters) in 1973 to 4.2 billion in 2005—a decline of 45 percent. Broadly calculated, the gallons of fuel used per ton of grain produced dropped from 33 in 1973 to 12 in 2005, an impressive decrease of 64 percent.
from Lester Brown, The Oil Intensity of Food
Notice here the phrase, “combined direct use of gasoline and diesel fuel”. This means that the 4.2 billion gallons in 2005 refers to dfo and gasoline, which could come from the same barrel of oil. The trouble is I don’t know what the proportion of dfo to gasoline is, and, Brown doesn't seem to recognize this point.
However, a 1997 report by the USDA gave these proportions for the period from 1973 to 1994:

from Agricultural Resources and Environmental Indicators, 1996-97 (unfortunately, a more recent 2003 report by the USDA didn’t even include a subchapter on energy inputs—maybe this was considered too unimportant?)
From the 1997 USDA report, the combined use of gasoline and diesel fuel in 1994 was 4.9 billion gallons (BG), a number that is slightly higher than the 4.2 BG in 2005, cited by Brown. If I assume that the proportions of dfo to gasoline use stayed the same as in 1994, then about 3 BG of dfo and 1.2 BG of gasoline was used for farm use in 2005
It is straightforward to calculate how many barrels of oil are needed to produce 3 BG of dfo, using the table I reproduced from the Texas Oil & Gas Association:
3 x 10⁹ G / 9.2 G/b = .326 x 109 b = 0.33 billion barrels per year (bbs/yr) in 2005
Notice that this same 0.33 bbs/yr of petroleum will also produce (19.5 G/b x 0.326 x 10⁹ b) 6.3 BG/yr of gasoline—more than enough to cover the estimated 1.2 BG of gasoline for farm use. Propane is also produced as a by-product of petroleum refining (a type of liquefied refinery gas and still gas) and from natural gas processing, so I don’t think that this would require additional barrels of oil to produce. In essence then, the dfo produced from a barrel of oil (in the USA at least) is the limiting end-use material of these three types of liquid fuel used in farming.
Therefore since the USA’s population in 2005 was 0.296 billion people (US census bureau), I can estimate that the per capita petroleum consumption for direct farm use of petroleum in 2005 equals about 1.1 barrels per person year (i.e., 1.1 b/py equals 0.236 bbs/y divided by 0.296 billion people, bp).
There are petroleum-based pesticides and fertilizers, and, petroleum based packaging materials involved. However most nitrogen fertilizer (e.g., ammonia) is produced from natural gas, (methane) and nitrogen in the air, not petroleum. Pesticides can be produced from the petrochemical feedstocks of the same barrels of oil used to produce the dfo. Polyethylene and polypropylene packaging is produced from ethylene and propylene, the still gas by-products of petroleum refining (here’s a short audio about Plastics that gives some history on this). Therefore I don’t see petroleum-based fertilizer and plastic packaging as requiring more petroleum as that already used to produce the dfo for farm use. That is, petroleum-based fertilizer, pesticides and plastic packaging are unlikely to be limiting factors in our present food production or delivery system as petroleum production declines.
However, petroleum consumed as dfo in the delivery of food to markets, and the consumption of gasoline by households driving to these markets, to buy the food, could be additional factors requiring additional petroleum consumption.
Petroleum use in food Transportation
A University of Michigan study by Hellar and Keoleian done in 2000 attempted to estimate the total amount of energy used for the entire food production and delivery system in the USA

Hellar and Keoleian commenting on this chart, state:
In total, providing the 3800 kilocalories of food energy available per capita per day in the United States United States U.S.
I want to point out that when Hellar and Keoleian are talking about "fossil energy," they are not just talking about petroleum, but also coal and natural gas (e.g., used to produce fertilizer, or, to generate electricity, for food processing and packaging, or, electricity as part of food cooking and food storage at home and in commercial businesses).
According to the EIA's 2009 Annual Energy Review, the petroleum energy input into total electricity production is only about 1 % (see energy flow diagram below), so I think that we can discount the use of petroleum for this aspect of food production (natural gas and coal are much more important than petroleum for electricity production). Petroleum provides some energy input into the industrial sector but by far petroleum is the key energy input for transportation—94% of the energy for transportation comes from petroleum and that 94% accounts for 72% of petroleum's use.

Unfortunately, Hellar and Keoleian made no attempt to consider what amounts of the energy inputs for food production could come from the same barrel of oil that could be used for different purposes in the food production system. As such, agricultural production, transportation, the processing and packaging in retail and commercial food services and household energy use, all get add into the "total energy used for food" basket. Consequently, the dfo, gasoline, plastic packaging, petroleum based fertilizer and pesticide used in these different energy categories all get separately counted as energy inputs into the total energy basket even though these could come from the same barrel of oil.
For my purposes, this amounts to double, triple or quadruple counting of the same barrel of oil—but I recognize this would not have led to as dramatic assessment as saying that providing food energy in the USA accounts for 10% of total energy use. I think that those who try to use Hellar and Keoleian's analysis as grounds for arguing that this 10% is all coming from petroleum really needs to go back and think about this some more. Similarly, it is very misleading to take this 10% of the USA total energy use (i.e., 10.2 quadrillion BTUs), convert this into "barrels of equivalent oil energy" and then portray these as the actual number of barrels of oil being used in the food production system.
Because Hellar and Keoleian didn't acknowledge that the same barrel of oil used could be used to provide for many of the energy inputs shown in their Figure 5, I don't find their numbers particularly useful.
Hellar and Keoleian's report, however, did provide some interesting data in their Appendix B which discussed energy used in transportation.
Petroleum used for Food Shopping
Hellar and Keoleian made the following estimates for food shopping:
According to the DOE Transportation Energy Book ... U.S. U.S.
0.253*(2.7786 x 1011)*5822 = 4.09 x 10¹⁴ BTU
from Appendix B of Life Cycle-Based Sustainability Indicators for Assessment of the U.S. Food System
To me, the idea of there being 2.2 trips to the grocery store per week exclusively for grocery shopping seems high, especially if we were considering this in the context of a future with limiting gasoline supplies or very high gasoline prices. Somehow, I think that in a pinch, and with some planning, US households could manage with 1 grocery shopping trip per week, or even 1 trip per month, without starving. But, I will just go with these numbers for now.
From Hellar and Keoleian's estimate, I can calculate (using the conversion factor of 1.73 x 10⁻⁷ barrels / btu from the EIA Energy Calculator) the number of barrels of oil equivalents (boe) used for grocery shopping in 1999:
(4.09 x 10¹⁴ btu) x (1.73 x 10⁻⁷ barrels / btu) = 7.07 x 10⁷ barrels or 0.07 billion boe
To put this on a per capita basis, I divide this number by the population of the USA in 1999 (0.279 bp) to give 0.25 b/py.
However, we have to recognize that the petroleum products used to fuel household shopping would be mostly gasoline, and this gasoline could come from the same barrel of oil used to produce the dfo for farm use, without requiring additional barrels oil.
For instance, I already estimated that 0.33 bbs/yr was needed to produce the 3 BG of dfo for farm use, and, that 0.33 bbs/yr would also produce and 6.2 BG of gasoline, only 1.2 BG of which gets used by farms. That leaves 5 BG left over. The above estimate of 0.07 billion boe means that about 1.4 BG gasoline (0.07 bbs x 19.5 G/b) is required for household shopping. As you can see, the unused 5 BG of gasoline produced from the oil that supplied the dfo for farm use, is more than enough to supply the 1.4 BG of gasoline used for shopping trips. Therefore, no additional oil needs to be refined to make up the gasoline used by households for food shopping.
Petroleum used for Food Delivery to Markets
From Appendix B of Hellar and Keoleian’s study, as discussed above, the total energy for shopping was estimated to be 4.09 x 10¹⁴ BTU, or 0.409 quadrillion BTU.
Therefore, of the 1.39 quadrillion btu attributed to transportation, we can take out the 0.409 quadrillion BTUs attributed to shopping, leaving 0.98 quadrillion btu for other transportation, which I will take to be the transport of food from farms to markets, and to the food processing plants inbetween. I can convert 0.98 quadrillion btu into barrel boe using the DOE's conversion factor of 0.173 bbs/1 qd btu (i.e., the same as 1.73 x 10⁻⁷ barrels / btu):
0.98 qd btu/yr x 0.173 bbs/1 qd btu = 0.17 billion boe/yr.
I don't know how much of this petroleum would separately provide the dfo and gasoline for trucking and other forms (e.g., train and water transport) of shipping, but for the purposes of this exercise, I will just assume that this is all dfo (for instance, Hellar and Keoleian assumed that all truck transport was fueled by dfo). If we assume it is all dfo that has to be provided, then 0.17 bbs of additional petroleum would have to be refined to generate the dfo.
In per capita terms, this would equal (0.17 bbs/yr / 0.279 bp) 0.64 b/py.
As pointed out by Hellar and Keoleian, however, the food transportation component of the food production system in the USA includes the current practice of transporting food over enormous distances:
A Cold War era study estimated that the average food item in the U.S. U.S. travels an estimated 1500 miles [145], primarily because 90% of all fresh vegetables consumed in the U.S.
Although this practice of large food miles appears to make sense economically at present, I think that this type of petroleum use would dramatically decrease in the face of declining petroleum production (and correspondingly high fuel prices, or, fuel rationing) without much consequence from the standpoint of still providing America's an adequate food supply. Therefore I don't think that this 0.64 b/py is a long term critical feature of the food production system. For example, if the average food miles were to be reduced from 1500 to 500, or to 150 miles, I do not think that this would lead to starvation. That is—no one is going to die if they can't get fruit from California in the winter time. In other words, transporting food over such enormous distances is more of a convenience than a necessity for most of the USA's population.
In my opinion, this estimate of 0.64 b/py for food deleivery transportation is probably on the high side, and I think that a range of 0.2 to 0.64 b/py is more realistic.
Summary
In summary, I estimate that the critical, or limiting, petroleum inputs of the food system are in the form of diesel fuel used in food production on farms (about 1.1 b/yp) and diesel fuel for food transportation to markets (presently about 0.6 b/py). Together, these critical needs can be met by a total of about 1.7 barrels of petroleum per person per year. All of the other petroleum products involved in the food system (pesticides, fertilizers, packaging gasoline for the public to drive to the grocery store) can be made from the other petroleum products produced from this same 1.7 barrels.
How does my estimated critical per capita petroleum consumption level of 1.7 b/py compare to the USA’s total per capita petroleum consumption?
It is really not that much.
As I reported in An Export Land Model Analysis for the USA-Part 4 the USA’s present per capita petroleum consumption is about 25 b/py (Figure 16). Therefore per capita petroleum consumption of 1.7 b/py for the present food system is less than 7 % of the total per capita petroleum consumption in the USA.
Based on this analysis, I propose that the critical level of per capita petroleum consumption needed to maintain the current developed-nation western-style food production/distribution system is probably in the range of 1.3 to 1.7 b/py. I put in the lower range of 1.3 b/py because, for the reasons explained above, my hunch is that the petroleum used to provide diesel for transporting food from farms to markets could be much lower than the present use without causing starvation.
If this is representative of the per capita petroleum input for a green revolution-style food system used globally today, then can we find any evidence of a population decline when per capita petroleum consumption dipped into or below this range?
Let’s see what we can find.
Regional data – the relationship between population change and per capita petroleum consumption
I am just presenting the same data as shown in Part 8, but this time, as an annual change in population (millions of people per year, p/y) versus per capita petroleum consumption (barrels per person year, b/py) for the seven world regions, and in some cases, the linear regression analysis results of these data.
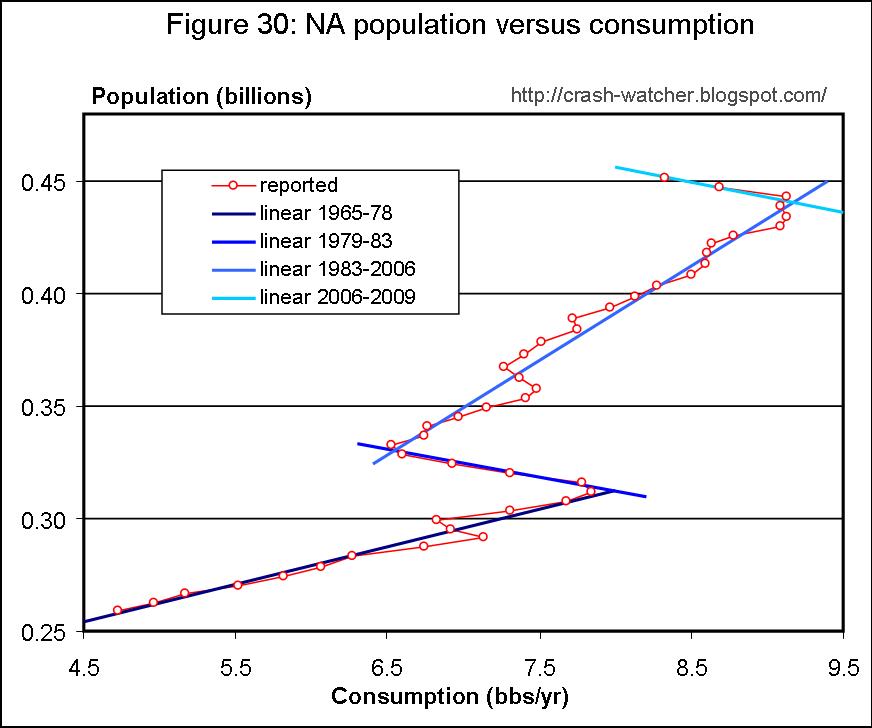
First let's look at the known heavy petroleum consuming regions: North America, NA; Europe, EU; Former Soviet Union, FS; South America, SA; and Middle East, ME (Figures 37-41)

First let's look at the known heavy petroleum consuming regions: North America, NA; Europe, EU; Former Soviet Union, FS; South America, SA; and Middle East, ME (Figures 37-41)


I speculate that any downturns in petroleum consumption in these regions was never enough to caused the per capita petroleum consumption to get below the critical level where the food production/delivery system was compromised.
Next, let's look at the two lowest petroleum consuming regions, Asia-Pacific, AP andAfrica , AF (Figure 42-43):
Next, let's look at the two lowest petroleum consuming regions, Asia-Pacific, AP and


These two regions are more interesting, in that at least there were periods in the 1960s and 70s where per capita consumption was less than 1.7 b/py. For instance, in AP, from 1965-71 (circled), the per capita consumption increased from 0.73 to 1.35 b/py, while in AF, from 1965-81 (circled), the per capita consumption increased from 0.6 to 1.1 b/py.
During these periods, for both regions, the population growth rate was increasing in direct step with incrasing consumption rates, perhaps suggestive of a causative relation, but by no means proving causation. Thereafter, the relationship breaks down.
In AP, the population growth rate stays in the 40-50 million / year range even though per capita consumption continued to increase. In AF, the population growth rate continues to increase from 14 million / year to 22 million per year even though the per capita consumption rate never increased above 1.2 b/py.
These trends are at least consistent with the idea that a per capita petroleum consumption rate of 1-1.2 b/py is enough to support an increasing population growth rate, but, further increases in consumption rate does not mean there will be an even greater population growth rate.
While interesting, neither AP nor AF provide data that addresses my specific question about what happens when the per capita consumption rate goes down.
Let’s do some further searching by looking at some selected countries (with thanks to Seani and Lucas for their suggestions).
The first three of these countries have gone through substantial declines petroleum consumption, and recoveries, at different periods within the last 20 year; and the last one, Ethiopia, never has had substantial petroluem consumption.
The BP statistical review doesn't report the petroleum production or consumption data for any of these countries, so I had to rely on data from the EIA which only goes back to 1980, and, I obtained the yearly population data from the US census bureau’s international database.
Figures 44-47 show the annual change in population (left axis, red circles) and per capita petroleum consumption (red axis, blue triangles) for Cuba , North Korea, Albania
Cuba’s special period refers to the time following break up of the Soviet Union in the early 90s where Cuba’s major trading partner and a major oil import source, Russia, dramatically reduced its petroleum production. Cuba
... In the late 1980s, farmers in Cuba were highly reliant on cheap fuels and petrochemicals imported from the Soviet Union , using more agrochemicals per acre than their American counterparts. In 1990, as the Soviet empire collapsed, Cuba
Cuban authorities responded by breaking up large state-owned farms, offering land to farming families, and encouraging the formation of small agricultural co-ops. Cuban farmers began employing oxen as a replacement for the tractors they could no longer afford to fuel. Cuban scientists began investigating biological methods of pest control and soil fertility enhancement. The government sponsored widespread education in organic food production, and the Cuban people adopted a mostly vegetarian diet out of necessity. Salaries for agricultural workers were raised, in many cases to above the levels of urban office workers. Urban gardens were encouraged in parking lots and on public lands, and thousands of rooftop gardens appeared. Small food animals such as chickens and rabbits began to be raised on rooftops as well.
As a result of these efforts, Cuba Cuba is now one-twentieth of that in the US
from: Threats of Peak Oil to the Global Food July 2005 by Richard Heinberg
The first thing to note about Cuba is that its per capita petroleum consumption rate since 1980 to present is much higher that the critical consumption level of 1.3-1.7 b/py estimated above, so this is probably not a very good country test case.

The second thing to note is that Cuba’s population growth rate had been in a long-term decline trend since the early 70s, long before the collapse of the Soviet Union in 1990. This reminds me of the same population declines trends I see in Europe or the former Soviet Union in Part 8. Some have attributed Cuba Cuba will have the highest percentage of seniors in Latin America , 26%, by 2025.
Cuba’s per capita petroleum consumption did decline by about 22% from 7.9 b/py in 1989 to 6.1 b/py in 1992. But population growth still remained positive, albeit less positive (the growth rate changing from 0.101 mil/yr in 1989 to 0.079 mil/yr in 1992). Following the first 22% decline in per capita consumption, consumption went back up by about 10 percent (6.1 b/py in 1993 to 6.7 b/py in 1997) but, population growth still continued on its downward trend. Another 22% decline in per capita petroleum consumption occurred from 2004 to 2006, and during this period the population growth went from positive (0.028 mil/yr) to negative (-0.019 mil/yr). The population decline trend continued even through per capita petroleum consumption went back up again from about 5.1 b/py to about 6 b/py in 2009.
To me the decline in population looks like it is a continuation of the long-term demographic trend, rather than evidence of starvation and death due to an inability to produce food. There are indications here, however, that the population growth decline was accelerated during the periods when the petroleum consumption rate declines by 22%.
As an aside, apparently Cuba is once again becoming increasingly dependent on the importation of food, at least in part, because of a change in focus towards producing food for the tourist use and for the export market, and, difficulty in finding people willing to do the labor-intensive work of farming (Cuba: Continuing Revolution and Contemporary Contradictions). No doubt, the demographics trend is not helping with the later.
It is thought that the population of North Korea endured famine at times during the 90s at least in part because industrial based food production went into decline (North Korean famine). However, during this same period there were also an number of natural disasters and a lack of foreign currency which both contributed to an economic downturn (see e.g., The Agricultural Crises in North Korea and Cuba -- Part 1).

As shown in Figure 45, North Korea’s per capita petroleum consumption ranged from 1 b/py in 1980 to 1.3 in 1991—this is right below my estimated critical range. But during this period, the population growth rate increased. Then, from 1991 to 2001, there was a dramatic 73% fall in per capita petroluem consumption from 1.34 to 0.36 b/py. After continuing to increase for a few more years, the population growth rate finally started to decline from a rate of 0.38 mil/yr in 1993 to only 0.04 mil/yr in 1998—nearly a 90% decline in population growth rate—but still a positive growth rate. So, despite the per capita petroleum consumption rate falling to only 0.36 b/py, the population continued to increase. Then from 1999 and on, despite further declines in the consumption rate (only 0.24 b/py in 2009!) the population growth rate actually increased somewhat in the range 0.19 to 0.14 mil/yr.
So, for North Korea we see the population growth rate collapsing a few years after the collapse in petroleum consumption rates. But, the growth rate never goes negative, and, despite further consumption rate declines, the population growth rate actually recovers somewhat.
I think this analsysis gets complicated by the fact that North Korea has relied upon food aid since the mid-1990's to prevent famine (U.S. Delegation in N.Korea to Assess Food Needs). According to an Amnesty International Report "Nearly a million people have died because of acute food shortages since the mid-1990s, and millions more, especially children and the elderly, suffer from chronic malnutrition." That aid has been controversial, as there is disagreement about whether or not famine is likely or that the food will go to those in greatest need and there is debate as to whether or to withhold food aid in order to get political concessions from the North Korean government (Debate rages about food aid to North Korea).
My assessment is that probably Korea's present consumption rate of 0.24 b/py is not enough to sustain its food production system in sufficient amounts to feed its population. Without food input, produced from petroleum-driven food production systems in other countries, North Korea would have have famine and a population decline-but food aid has prevented this from happening, at least on a large scale.
Albania is one of the few countries since WWII that has been even more politically isolated than North Korea Albania transitioned from being a net petroleum exporter to an importer (History of Oil in Albania). The collapse of the communist government also resulted in massive social unrest and emigration out of the country, so this complicates the analsysis of a population declining due to a decline in food production due to declining petroleum consumption.

As illustrated, Albania’s per capita petroleum consumption rate from 1980 on was in a downward trend, perhaps as part of the country's transition from being an oil exporter to importer. From 1980 to 1990, per capita consumption declined by 64% from 6.29 b/py to 2.25 b/py. Despite this decline, however, the population growth rate remained stable at 0.05-0.06 mil/yr. Perhaps I should not expect any population change during this period because even 2.25 b/py is substantially higher than my estimate critical per capita consumption rate range of 1.3-1.7 b/py.
After 1990, Albania’s population growth rate turned negative, for three years. But by 1994, the population growth rate was positive again and nearly back to its pre-1990 level. Per capita petroleum consumption, during the period when population growth was returning to positive, actual went down further into the range of 1.3 to 1.7 b/py from 1994-97. Then, the petroleum consumption rate recovered to greater than 2 b/py and has steadily increased to nearly 4 b/py, while the population growth rate again declined into negative territory, although it has recently recovered to about a zero growth rate.
Albania's steady decade-plus decline in per capita consumption rate through the 1980s was not accompanied by a population decline, or even a growth rate decline, until after 1990. And, during the period when consumption dipped into my estimated critical range of 1.3-1.7 b/py population growth actually recovered into positive territory.
The were reports of rural areas of Albania being threaten by famine (Albania says rural areas face famine; vows reforms) and there were food shortages in urban areas in 1991. But at least in part these food shortages were likely due to a three-year drought that started in the late 1980's. Additionally, Albania got international food-aid for about a decade from about 1997 to 2006 (WFP ends food aid to Albania thanks to improved food security), although at least in part this was to help feed Kosovars who fled into Albania in search of refuge during the Kosovo Conflict in 1997.
Overall it looks like Albania for a few years had a population collapse, but becasue there were multiple causes (drought, political upheaval, emigration) I can not point to the long-term decline in petroleum consumption as being the key casual factor.
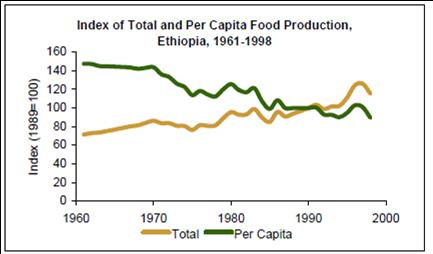
Ethiopia
Here is the analogous plot of population growth rate and per capita petroluem consumption for Ethiopia:

I could have presented a number of similar plots for other countries from North Africa (see e.g., Survey of Oil Exports from North Africa), but, Ethiopia nicely illustrates the point that even at a very low per capita petroleum consumption rate (never greater than 0.2 b/py since at least 1965), a country's population can continue to increase. Just look at that near linear increase in population growth rate, corresponding to about 3% per year for the past 15 years—all with per capita petroleum consumption ranging from 0.07 b/py to 0.19 b/py.
Ethiopia population hasn't grown without external help or influence, however.
Ethiopia is an agrarian society with 85% of total job occupations, and 45% of GDP, based on agriculture (CIA fact book Ethiopia). Still, this is not enough to be food self sufficient and Ethiopia
Therefore it seems that without the external inputs of food aid, Ethiopia would have had famine, and, most likely a population decline or at least a slower population growth rate than 3% per year.
I interpret this to indicat that a petroluem consumption rate of less than 0.2 b/py has not been enough to support Ethiopia's present population and growth. Rather, Ethiopia has and will continue get external food aid, supplied from petroleum driven farming in other countries, to continue this trend.
--------------
I had hoped to close out this series today, but I see that this post has exploded into one of my longer ones, and, it will take me a considerable amount of time to sum up the series. So, I will have to ask you to come back to part 10 to read my summation and the implications of these results for the prospects of population change in the face of declining petroleum production.