In this post, I summarize my export land model analysis of China
Data Analysis Method
My approach to data analysis is the same as what I have done in the past in my multi-part global regional survey. In that survey, China China
All production, consumption and import/export rates (dQ/dt) are reported in units of billions of barrels per year (bbs/yr). I used the production and consumption data to derive a “reported” net exports (or imports), as production minus domestic consumption.
I fit a logistic models (aka, the Hubbert Equation) to the petroleum consumption and production data using non-linear least squares (NLLS) analysis to obtain the best fit. Further details of the modeling are presented in the series: Refining the peak oil rosy scenario. Predicted future import/export trends are derived from the predicted production rate minus the predicted consumption rate.
Production, Consumption and Export/Import Trends
Figure 1 presents the reported production, consumption, and my derived net export/import, rates (blue, red and green open circles respectively) and the corresponding NLLS best curves (solid lines with the same respective colors) to these data.

Both of the reported production rates and consumption rates for the have two distinct stages corresponding to 1965-82 and 1983-2010. Accordingly, I modeled production and consumption using two separate Logistic equations for these periods. The residual-sums-of-squares (rss) of the best fit from the six-parameter two logistic models were significantly better than the rss from the three parameter single logistic model (F-test for the significance of extra parameters, p << 0.001).
The scale used to show extrapolated future consumption is so large that the reported past production and consumption numbers are some what obscured, so I show the same data in an expanded scale, in Figure 1a.

From about 1973 to 1993, China
Since 1983, China
The NLLS best fit parameters Qo, Q∞ and the rate constant, "a," corresponding to the solid lines in Figure 1 are summarized in Table 1 below:
Table 1 summary of NLLS best fit parameter for production and consumption | |||
Qo (bbs) | Q∞ (bbs) | a (yr-1) | |
Production 1965-82 | 0.24 | 12 | 0.26 |
Production 1983-2010 | 30 | 196 | 0.033 |
Consumption 1965-82 | 0.22 | 10 | 0.26 |
Consumption 1983-2010 | 7.3 | 485 | 0.074 |
After a rapid phase of increasing petroleum production at 26%/yr in the 1960s and 70s, resulting in a local peak of 0.78 bbs/yr in 1980, production has continued to increase since 1982, but at a much slower rate of 3.3%/yr.
The rate of increase in consumption followed the domestic production trend until 1982, when the rate of increase in consumption slowed. However, since then, the consumption rate increase is still more than double (7.4%/yr) the rate of domestic production increase (3.3%/yr), with the resulting imbalance being made up by increasing imports.
According to the EIA, China in 2010, is now the world’s second largest importer of petroleum, second only the USA
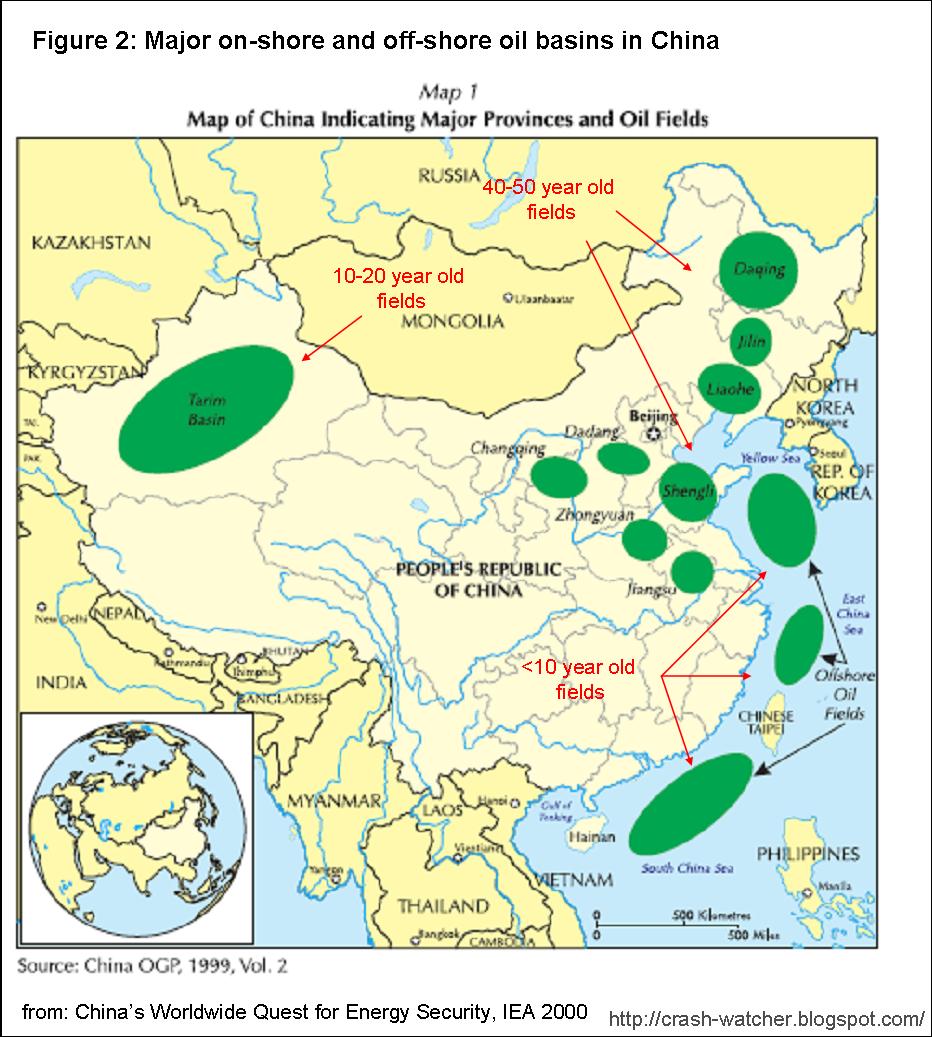
I think that it is no coincidence that the signs of peaking domestic production in the late70s coincided with the timing of China China ’s leadership probably saw that their domestic production was peaking, reflecting the aging of the Daqing field in far northeast China
Future development of oil production from the East and South China Seas is, and will continue to be controversial, as several other countries in the Asia Pacific region (Japan , Philippines , Malaysia , Taiwan , and Vietnam China , and so, the bulk of these offshore fields essentially are “in” China
As discussed above, domestic production from the more newly developed oil basins has caused overall production to steadily increase since 1982. But consumption has increased much faster over this period, causing China to increasingly look abroad, first in other parts of the Asia Pacific (AP) region, but increasingly to the Middle East (ME), Africa (AF), the former Soviet Union (FS) countries and South America (SA) :
In 1990, just three countries merited breakout in the data as key suppliers of crude oil: Indonesia , Oman and Iran Oman (which had displaced Indonesia as principal supplier, shipping three times as much crude as China ’s total imports in 1990), Yemen , Iran and Saudi Arabia in the Middle East; Indonesia in Asia; Angola and Congo in Africa; and Argentina , the United States and Russia
Since the time of this year 2000 IEA report, petroleum net exports for a number of these supplier countries declined, or stopped altogether. For instance, a former key supplier, Indonesia , has become a net petroleum importer, and, both Oman and Yemen Argentina in 2010 is just barely still a net exporter, producing 0.24 bbs/yr, but, consuming 0.20 bbs/yr, so Argentina
The EIA presented the 2010 break down of China ’s import sources, in its Country Analysis Brief for China, reproduced below, in Figure 3

Over half of China ’s imports came from Saudi Arabia , Angola , Iran and Oman Angola Iran and Saudi Arabia ’s net exports have been flat, and will probably decline due to increasing domestic consumption (see Survey of Oil Exports from the Middle East). The continuing trend for sanctions against Iran may push more Iranian oil to China
Figure 4 shows the percentage of China

The estimate of the global export pool comes from my previous study examining the production, consumption and net interregional exports for seven world regions (Figure 8 from Estimating the End of Global Petroleum Exports: Part 4 future global net export trends). That earlier study showed that the ME, SA, AF and FS regions are net petroleum exporters and that the NA, EU and AP regions are net importers. I predicted that inter-regional net exports would steadily decline and then end sometime between 2030 and 2035, depending on whether remaining exporters share or don’t the remaining export pool with ex-exporters.
Figure 4, illustrates that, despite signs of diminishing export sources, China China
Just how long can this import trend continue?
Some speculative futures trends
If the present trends continued unabated, as suggested by the blue and red lines in Figure 1, then by 2030, China China China
To put this into some perspective, this level of consumption and import dependence would much higher than the USA’s 2009 onsumption of 6.8 bbs/yr, and 61% dependence on imports to support that consumption (derived from Figure 11 of Trends in USA Petroleum Production and Consumption). Indeed, the USA
However, this is not what I am expecting to happen to China
If the trends predicted in my previous multi-part global regional survey are correct, and inter-regional net exports end sometime between 2030 and 2035, then China
Figure 5 presents three speculative scenarios of whatChina
Figure 5 presents three speculative scenarios of what

The first two scenarios assume that the percentage of China
In scenario I, the diminishing pool of exports is assumed to be proportionally shared with the former exporters regions, as they become the net importers. In this case, as shown by the solid red line, the predicted outcome for Chinese consumption: a steady decline back down to its domestic production level by 2030.
In scenario II, it is assumed that there is no sharing with the ex-exporters. In this case, the decline down to its domestic production level is extended by 5 years to 2035 (long dashed line).
In scenario III (short red dashes), I more optimistically assume that China is able to maintain its present linear expanding rate of importation of the inter-regional net export pool, as shown in Figure 4, right up to the end of exports in 2035 (assuming a no sharing scenario).
In 2034,China would be importing 30 percent of the export pool, but, the pool by then is so small as to add negligibly to China China
In 2034,
The most recent consumption figures for 2010 suggests that all three of these scenarios are too pessimistic. China
Since China’s production in 2010 is close to my prediction line (blue solid line in Figure 1, an dotted line in Figure 5), this relative spike in consumption signifies a spike in imports. To have this kind spike in imports means that either the inter-regional export pool spiked, or, China’s proportion of the inter-regional export pool spiked above the trend line shown in Figure 4, or, perhaps a combination of both occurring.
Figure 6 presents China’s reported consumption and these speculative future trends in terms of per capita consumption in units of barrels per person per year (b/py), and, China’s reported and predicted population change out to 2050 (from the US Census Bureau International Database).

The census bureau predicts that China China
On the other hand, if any of scenarios I, II, or III occur, or at least are close to reality, then China's per capita consumption will remain in the low 2s b/py and drop down to a plateau of 1.2 b/py by 2030-35. The plateau exists because the predicted downward trend in population ("x" Figure 6) is roughly matched by the predicted downward trend in domestic petroluem production (blue doted line, Figure 5).
Conclusions
Although an export land model study of China is interesting in it own right, I did this study now as a prelude to a subsequent export land model analysis of food energy production, consumption and exports/imports.
I wanted to have an idea of what China’s petroleum consumption situation might look like when analyzing China’s food energy production and conception food situation, which will be forth-coming in December.
Based on the scenarios explored in Figure 6, it looks like China
That means by 2030-35, there will be not much petroleum left over for anything else, which in turn, means no economic growth. In fact, I expect thatChina China
That means by 2030-35, there will be not much petroleum left over for anything else, which in turn, means no economic growth. In fact, I expect that
------------------------
Next time, I will report on my export land model analysis of food energy production for China
This comment has been removed by the author.
ReplyDeleteI admire this article for the well-researched content and excellent wording. I got so involved in this material that I couldn’t stop reading. I am impressed with your work and skill. Thank you so much. Energy Dias is the world’s first full-stream online platform of Oil and Gas Industry. Visit our oil and gas directory portal to explore and connect with 3000+ verified oil and gas companies. We also bring you the latest oil and gas news through our news portal in short 70 words snippets. Join our oil and gas job portal to explore 15000+ oil and gas jobs. Oil and Gas Directory
ReplyDeleteI have read your article, it is very informative and helpful for me.I admire the valuable information you offer in your articles. Thanks for posting it.. The Blowout Preventers were invented in the year 1922 by James Abercrombie (1891-1975) and Harry Cameron (1872-1928) in response to the challenges involved in drilling operations. Since then, they have continued to transform the energy landscape by enhancing rig safety. In the year 2003, the American Society of Mechanical Engineers recognized and acknowledged the Cameron Ram-Type Blow-out Preventer as a ‘historic mechanical engineering landmark’. Here is the list of Top blowout preventer manufacturers usa. blowout preventer manufacturers usa
ReplyDeleteI admire this article for the well-researched content and excellent wording. I got so involved in this material that I couldn’t stop reading. I am impressed with your work and skill. Thank you so much. offshore
ReplyDeleteInformative article. Thanks for sharing.
ReplyDeleteDiesel fuel suppliers in UAE