This is the tenth and final part of this series where I summarize my analysis of regional petroleum production and consumption trends, and, the implications this has for population growth. I predict that population growth will continue or remain stable, with no global die-off for quite some time, although some regions, like Africa , may suffer a die-off soon.
Summary of Parts 1-9
I launched this study with the goal of performing a world-wide export land model analysis of (instead of just the USA as I did previously), by analyzing the petroleum production trends for seven large regions: North America, Europe, the former Soviet Union, the Middle East, South America, Asia-Pacific, and Africa.
As explained in part 1, the production and consumption data for these regions is described or is derivable from the BP Statistical Review back to 1965. In part 2 and part 3, I analyzed the production and consumption trends in these regions and based on this analysis, I predicted the export/import trends for these regions in part 4.
My analysis showed that exports for the four net exporting regions: Middle East, Africa, former Soviet Union and South America , will all drop off to zero between about 2017 and 2030-35, depending on whether some of these ex-exporter regions after 2017 themselves become petroleum importers or not.
As shown in part 5, petroleum consumption trends will have to change dramatically over the next 20 years as exports decline and intra-regional production rates also declines. Future petroleum consumption rates in Europe and Africa look especially troublesome if the predicted trend in production and exports continues. That is fro Europe and Africa domestic production will be approaching zero at about the same time net global exports approach zero. In terms of per capita petroleum consumption rate (Figure 18, part 5), however, the Asia Pacific region, which is heavily dependent in getting exports from the net exporting regions, joins Europe and Africa in looking very poor off by the mid 2030s. By 2020, South America and the former Soviet Union countries will be better off than Europe, and North America and the Middle East look the best off, relatively speaking.
At this point in the series, I shifted my attention away from export land model considerations, towards considering what my analysis said about global peak oil production and total remain reserves of petroleum in these regions and globally. In part 6 I showed that, based on the analysis done in parts 2 and 3, all seven of these regions are past 50% depletion of their total recoverable oil. In part 6 I also pointed out that because this analysis is considering seven times more data than a simple analysis of total global production, it should provide a more accurate model of future global production and total recoverable oil. Based on this composite 7-region analysis, I estimated that world peak petroleum production occurred in 2007 and that presently the total recoverably petroleum is about 60% depleted. This is a strikingly different result than predicted from doing the same kind of analysis of total global production.
Starting in part 7, I shifted my attention away from petroleum production towards looking at the relationship between my predictions of global petroleum consumption rate and global population growth, or, predicted regional petroleum consumption rate and regional population growth. I considered two different scenarios: an immediate decline in population in lock-step with the predicted decline in petroleum production/consumption (Figure 28), or, continued population growth even in the face of declining petroleum production/consumption (Figure 25).
Although there is a linear correlation between petroleum consumption rates and population, in part 8, I showed that this was not a simple causal relationship. In particular, for periods when there was a down-turn in petroleum consumption in the early 80s as well as in North America, Europe, South America or Asia Pacific regions, there was no decline in population. Even during a 54% decline in petroleum consumption rate in the former Soviet Union during the early 1990s, the population change barely turned negative. That is, no big die-off.
I speculated that the reason for the absence of a relationship between population change and petroleum consumption was that even during the periods of dramatic consumption decline there was still more than enough petroleum available to ensure that the modern food production and delivery system could still function.
Still, there must be some critical level of petroleum consumption rate in a country below which the food production system begins to fall apart.
In part 9, I estimated that critical level of petroleum consumption to sustain the prototypical petroleum-drive green revolution style food system—the USA Africa up to the early 80s. The plot for Africa (Figure 43, part 9) I thought was very interesting—once per capita consumption got above 1.1 b/py, population growth continues without the need for larger inputs of petroleum consumption.
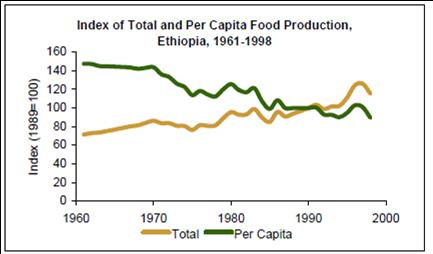
Thanks to some reader suggestions, I looked at the per capita consumption of two countries that have experienced some enormous declines in petroleum consumption: North Korea and Albania. North Korea Ethiopia
Implications for population change
If 1.2 b/py is enough to keep Africa’s population growing, but 0.2 is not enough for North Korea's or Ethiopia's population to be maintained without getting food aid, then I think that I should decrease my estimate of the critical level of per capita petroleum consumption from 1.7 b/py, derived in part 9, down to something between 1.2 and 0.2 b/py.
The relationship between food and petroleum consumption deserves further study, which I plan to do in the future. But for now, based on the present analysis, for the remaining discussion, I will take 1.1 b/py as my best-estimate of the minimum per capita consumption level needed to sustain a petroleum-driven food production system.
Even the USA
Based on this estimate, I think I can say something about future population trends in light of declining petroleum production and consumption rates, that is in light of "peak oil".
In particular, if I assume that 1.1 b/py is the critical number needed to sustain the modern food production system then what implications does this have for population growth globally, or, for the seven regions that has been the topic of this series?
Let's look at two opposing scenarios.
A fungible-food sharing scenario
This is pretty simple—just go back to Figure 25 in part 7 and ask, when does global per capita consumption get down to 1.1 b/py, and, what is the population at that point?

The global per capita petroleum production rate is predicted to drop to 1.1 b/py in 2037. According to the US census bureau, the world's population by 2037 is 8.6 billion. That sounds pretty close to Cribb's scenario (part 7) of 9 billion, at least until the food production system collapses.
After 2037, unlike the census bureau's prediction of further population growth, I expect that the world's population would decline as petroleum driven food production system goes into decline due to deminishing petroleum inputs. To a first approximation, I expect the population to decline in proportion to the rate of decline in global petroleum production, such as presented in Figure 20, part 6.
What does the global population collapse down to?
Well, in the absence of an adequate transportation fuel as a replacement for petroleum, I expect that the population would go back down to a pre-petroleum level. For the purposes of this discussion, let's just say that number is about 1.6 billion—the World's populations in 1900, or 1.2 billion—the World's population in 1850 (see e.g., The World at Six Billion).
The dashed line in the reprisal of Figure 25 shows the resulting population trend after 2037—a steep decline in proportion to the decline rate in petroleum production. This is equivalent to saying that per capita consumption is fixed to 1.1 b/py. So, as petroluem production declines, so to does the population to stay at this critical level of per capita consumption. According to this scenario, a population decline to a 1900 level of 1.6 billion would be reached in about 2073 (orm a 1850 population 1.2 billion would be reached in 2079). That's a population decline of 6-6.4 billion people in 36-40 years, or, 166 to 160 million per year.
Presumably, at that point (analogous to 1900 or 1850), non-petroleum dependent food production systems would still be able to sustain the world's population in the range of 1.6-1.2 billion. I admit that this might not a great assumption because other resources, like ground water, may have been depleted to the point where even ths population level couldn't be supported. But this analysis is complicated enough without trying to introduce multiple additional factors into the mix at this point. This analysis is a petroleum-centric analysis.
A world population ultimately collapsing from 8.6 to 1.6 billion in 36 years sounds pretty close to Hanson's die off scenario (part 7), its only that the global die-off starts to happen in the late 2030s instead of right now as I had posed earlier in part 7.
The scenario I just outlined has assumed that there is complete fungibly of the food produced by the global petroleum driven agricultural system. If there really was total global sharing of petroleum-driven food production, then I think that the above scenario would be reasonable.
But that is clearly not happening now.
Yes, there is food aid presently being sent from the petroleum-based food producers to the undeveloped petroleum and food deficient countries, but there are plenty of asymmetries: some regions have undernourished populations, while other regions suffer obesity epidemics.
As petroleum production and standards-of-living decline globally, and food prices go up, due to peak oil, I think that is likely that food aid will end, or, at least be grossly insufficient to feed a growing global population of hunger people. We will likely see increasing periods of food exports being banned by governments in attempt to keep domestic prices down, or, for other purposes (Food: The Hidden Driver Of Global Politics).
If this is the case, then some regions will have major food deficiencies sooner than other regions will. In other words, there would be regional die-offs long before there is a general global die-off.
A regional non fungible-no food sharing scenario
We can look at the predicted regional per capita consumption trends from Figure 18, part 5 to see where the regional problems will arise first. In this scenario, where I assume the complete absence of fungible food sharing, the population in some regions of the world will still grow, while other parts of the world, there will be a population decline when that region drops below the critical level of petroleum consumption needed to maintain food production.
Here is a reprise of the predicted per capita petroleum consumption trends for the seven regions (Figure 18, part 5) where I note the year when 1.1 b/py is reached.

Analogous to the calculation done above, for estimating global population changes assuming complete global fungible food sharing, this scenario estimates regional population changes assuming that each region's population follows the trend predicted by the US Census Bureau until per capita consumption falls below 1.1 b/py. At that point, the scenario predicts the population going down in proportion to that region's declining petroleum production rate. The predicted production rate for the individual regions was present in part 2 and part 3.
Figure 48 summarizes the results of this analysis, showing the predicted population change for each region. Because the population of Asia-Pacific is much higher than all the other regions (about the same as all other regions combined), I also present, in Figure 49, an expanded version of Figure 50 with the vertical scale increased and Asia-Pacific not shown—this is the same data as shown in Figure 48.


Africa is the first region predicted to have major problems with producing adequate food, as I estimate that Africa's per capita consumption will have already dropped below 1.1 in 2010 (the data in the BP Statistical Review only goes up to 2009).
Given its present petroleum production trend, and this scenario's assumption of no food aid from other regions, Africa's population would go into immediate decline from its present peak population of 1 billion to a pre-petroleum level of 133 (Africa's estimated population in 1900, from The World at Six Billion) by 2022 as its petroleum production rapidly declines. This is a huge 87% decline in relative population over a decade's period of time.
Next is Asia-Pacific, whose per capita consumption is predicted to drop below 1.1 b/py in 2022. I don't have a direct historic population estimate for the Asia-Pacific region, as defined in the BP statistical review, but, I can derive this as follows:
According to the population estimates in the Netherlands Environmental Assessment Agency's, History Database of the Global Environment (HYDE version 3.1) the Commonwealth of Independent States (basically the former Soviet Union) in 1900 had a population of 0.121 billion, and the Middle East had a population of 0.037 billion. I can subtract these two from HYDE's population estimate of Asia in 1900 (0.902 billion in 1900), and add in Oceania (0.005 billion in 1900), to get a 1900 population equivalent to the BP statistical review's definition of Asia-Pacific: 0.74 billion.
This scenario predicts that the Asia-Pacific region would reach 0.74 billion in 2064 from a peak population of 4.2 billion in 2021. Because of Asia-Pacific's huge population compared to all of the other regions, this decline would account for the largest magnitude drop population—4 billion people—of all the regions.
The next region to drop below 1.1 b/py is Europe in 2028—according The World at Six Billion Europe's population in 1900 was 0.4 billion. Because Europe's petroleum production, like Africa's , is in sharp decline, this scenario predicts a very sharp decline in population from 0.60 billion in 2028 to 0.4 billion by 2031—essentially a die-off of 200 million people.
The former Soviet Union region drops below 1.1 b/py in 2048—it takes this long time to reach this critical per capita consumption level, in part because FSU's consumption rate is projected to be flat, and, because its population is already in decline. The FSU's peak population peak actually occurred in about 1993 (0.29 billion) and has been in decline since then. As noted above, according to HYDE version 3.1, FSU's population in 1900 was 0.121 billion. This scenario predicts FSU's population declining to 0.121 billion in 2054 from 0.26 billion in 2047—again another sharp die-off because the predicted petroleum production decline curve is steep.
Neither the Middle East nor North America decline below 1.1 b/py by 2050, the year to which I took per capita consumptions numbers out to for Figure 18. Therefore under this scenario, neither of these regions would experience population declines until after 2050. For the record, according to The World at Six Billion the population of North America in 1900 was 0.082 billion, and as noted above, HYDE's estimate of the Middle East's population in 1900 was a mere 0.037 billion. My rough estimate is that the population in ME and NA would not decline to back to these levels until the 2080s or beyond.
Here is the reprisal of the population curve in Figure 25, now including the predicted cumulative population change based on the second scenario, as summarized above and shown in Figure 48.

As you can see, despite the predicted sharp population decline in Africa , the global population stays flat. This is mainly due to the continued population increase in Asia-Pacific until 2022. The global population goes down after 2022 when Asia-Pacific's population is predicted to decline. Because the population of Asia-Pacific is so huge, the global population declines despite continued population increases in South America and the former Soviet Union regions until the late 2040's and beyond that in the Middle East and North America.
I expect that the "reality zone" will be somewhere in the hatched area between these two extreme scenarios of complete fungible food sharing between regions and complete non fungible no food sharing.
I don't really expect that food aid to Africa would end right now, as assumed in the second scenario. So Africa's population, and the global population, will likely continue to climb along the US census bureau's prediction line.
However, at some point, maybe in the early 2020's, the economies of the more developed regions will be too weak, and the domestic humanitarian crisis too large, to continue the food aid programs that, up to now, have prevented depopulation. For example, I think that it will be very hard, and unrealistic, to expect Europeans after 2030 to continue sending food aid to Africa , when its own people are hungry. And, it should not take people until 2030 to see the looming domestic crisis in Europe —when this recognition occurs, I expect food-aid to curtail dramatically.
And, even if food-aid were somehow continued to 2037 and beyond, then the entire world's population would go down together, once global per capita consumption drops below 1.1 b/py, or, whatever the critical number turns out to be.
Criticisms, Alternative Scenarios and Final Thoughts
Other factors may be more important
A legitimate criticism, or limitation, of my population prediction scenarios is that petroleum is the rate limiting resource in the food production system. I fully admit that this assumption could be wrong. As I noted in part 7, Cribb discussed several other resources that could limit food production: scarcity of fresh water, farm land being encroached by urban sprawl, overused soils being depleted of nutrients, declining fish stock and climate change.
At least some of these, like urban sprawl, over fishing or climate change, are likely linked or made possible by petroleum consumption, but others, like water scarcity and soil depletion, are separate major resource problems in their own right. If one of these, not petroleum, is the rate limiting resource in food production, then I expect that the population decline should occur earlier, and, the shape of the population decline both, globally and regionally, may differ from what is predicted here. I still expect that Africa and Asia will problematic however.
The food productions problems for Africa are amplified when the governments of famine-prone countries, like Ethiopia, sell off the country's farm land and water rights in land grabs by Asia and the Middle East (Why the list is incomplete: land grab deals; When the Nile Runs Dry). What a receipt for domestic conflict and revolution!
But I was really counting on a die-off
Some readers may be upset with my prediction that the population will likely continue to increase, especially in North America , not necessarily because they have an issue with the analysis, but rather because they were actually counting on, or hoping for, a die-off.
KMO’s c-realm show touched upon this in some recent episodes, although sometimes in a different context than I am discussing here. There are those counting on a die-off to help improve their own social status. Others seem to hate humans for wrecking the planet and believe that most of us deserve to die to help save the planet. Still others will just find that the idea of continued population growth clashes with their true believer mind set, and, blow all of this off as a faulty analysis.
Personally, if the die-off includes me, then I’m against it!
Therein lays a problem: everybody wants to live, and, humans are incredibly resilient and capable of finding ways to survive even in very inhospitable conditions. Think of Ethiopia's extended population boom continuing virtually in the absence of oil.
An oil problem, what problem?
Speaking of true believers, still others reject the idea that oil does not present any kind of near term problem, that there is plenty of oil, and, decades of time to adjust, as we move through an “undulating plateau” of production.
Okay, that’s fine, when there is some actual production data reported in the BP Statistical review to support this, I will adjust my model accordingly, like I did for the USA. However, for the reasons explained in part 6, it is by no means a given that new oil wells will be discovered at a sufficient rate, or, that recovery methods will improve at a rate sufficient, to cause an undulating plateau of production. At present, in my opinion, the published production data for most of the regions studied here does not support this. Rather, the data suggests to me that production will go down. In the mean time, consumption rates are going up in those parts of the world that still are net exporters, resulting in more rapidly declining net exports.
Black swans versus a slow wind down
Another criticism, or limitation, of these modeling efforts is that the model doesn’t account for geopolitical events like Libya or other black swan events, or the interactions between the black swan event and oil production and consumption.
This about the same as saying, “some unpredictable earth shattering event 'X' is absolutely going to happen for sure, so don’t even both to model this” or "unless you model everything at the same time and in a totally interactive way, this is just a waste of my time."
Well if that works for you, fine. I have heard of people who after 20 minutes looking at a video about peak oil, don't even want to finish the video—they just want to know "what should I do next?" However, I worry about these people burning out after a few frantic years of preparation and then finding that the world is still about the same as it was before they started their preps.
In my opinion, you should be ready for hard times, but you should also be psychologically ready for many different possible future senarios. Thinking through some scenarios in detail, as I did here and in past series, helps me gain a better understanding of the issues and pressures points, even if things don't play out the way the model predicted in the long run.
What if that favorite black swan of yours doesn’t occur? Maybe things will just go on as they are now. Or maybe there is a more gradual, earth shattering change, occurring right now, but because the change is occurring gradually, we tend not to notice, or we just reset our perception of what passes for normal as the changes unfold. I think that running scenarios, out as done here, helps accelerate time so that we can see these types of changes more clearly.
I am not saying that black swans will not occur along the way to slowly winding down on petroleum consumption, or, that you shouldn't try and be ready for unexpected disruptions as best you can. In my opinion, you just probably should not go "all in," financially or psychologically, on any one scenario.
You might be interested to know that I actually did model for a black swan event in a past series. Go read Transport Fuel Rationing in the USA: Part 1 - Introduction. Instead of a conflict in the Middle-East as posed there, just insert your own favorite black swan event: war, natural disaster, political upheaval etc..., which would cause 10% or more of the world’s oil production to go off line, at least for several months. The consequence, in my opinion, will likely be hoarding, followed by some form of Martial law, followed by fuel and food rationing, depending on the severity and length of the disruption. There could be extended periods of food shortage during these times due to a disruption in the food transportation system. However, as the disruption dissipates I would expect to see an easing or lifting of rationing and Martial law for some period of time, and a return to "normal" albeit at a lower level of petroleum consumption than before. Then, the next black swan event arrives and the process repeats. Lather, rinse, repeat. This cycle could play out over a decade or two.
The bumpy ride down
I do also not expect the declines in petroluem production and consumption to follow smooth mathematical curves, although I do expect them to follow the general trend of these curves. Just look at the growth sides of the global production and consumption curves in Figure 20 of Part 6—you should expect that the decline sides of these curve should be at least as bumpy.
I use mathematical models—based on a logistic model of change with a finite resource of oil (Q¥)—to look at production and consumption trends and then use the models to extrapolate into the future. Some may say that this has no basis in reality, but those who say this may not have studied Hubbert’s original work.
As I discussed in Refining the Peak Oil Rosy Scenario Part 3 and Part 4, Hubbert knew that the logistic equation was derived originally by a Belgian demographer, Verhulst, in the mid 1800s to study human population growth. Hubbert also recognized that the spike in population over the last 200 years was likely due to the energy supplied from fossil fuels, in particular coal and petroleum. Hubbert further recognized that the human population would go back down to that of an agrarian existence if these energy resources, once used up, were not replace by another energy source.
A brief rant about a massive squandering of petroleum resources
Perhaps what Hubbert could not have imagined was just how much oil would get wasted on non-biologically important activities, that is, non-food producing activity.
In part 9 of this series, I pointed out that the USA
What about the other 93%?
Well, some of it is to support other seemly critical uses beside food production, and some of it is wasted on mostly non-critical activities, such as enabling the public to drive around and to drive “growth.”
In an earlier series, Transport Fuel Rationing in the USA: Part 2 Estimating Gasoline and Diesel use in the USA today, my attention was focused on gasoline and dfo use in the context of a emergency rationing scenario, but the analysis provides some number to illustrate how much petroleum gets used, or, wasted.
Of the 368 million gallons of gasoline used per day in the USA
A higher relative amount of the diesel (dfo) supply, 83% (about 126 million G dfo/d), gets used for the "critical uses," with only 17% being for household use.
It takes only about 2.6 million barrels of oil per day or 0.97 bbs/yr to supply the critical needs amount of gasoline (i.e., 52 x 106 G dfo/d / 19.5 G dfo/b). But, it takes 13.7 million barrels of oil per day or 5 bbs/yr to supply "critical use" amounts of dfo (i.e., 126 x 106 G dfo/d / 9.2 G dfo/b). Clearly dfo is the limiting quantity as far as critical uses are concerned. Of course, the food production system using about 1.7 b/py, is a subcategory within this 5 bbs/yr.
The USA
So if 5 bbs/yr is for critical uses then the remainder 2 bbs/yr is squandered to support non-critical household uses.
"Wait at minute" you might say, "driving to work is not a 'non-critical use'—if people don't drive to work then the economy will crash and people will starve because they can't buy food." I would slightly disagree. If people can't get to work then, yes, there is a problem—but getting to work does not necessarily require that everyone separately drives to work in a 2 ton vehicle. Millions (billions?) of people everyday get to work without driving a 2 ton vehicle. As much fun as driving around in your own car may be, in my opinion, compared to preserving petroleum so that food can be produced for future generations, this amounts to squandering a precious resource.
And what about that 5 bbs/yr used to produce diesel for those "critical uses?" Unfortunately, I think that most of the petroleum consumed in these "critical uses" also gets squandered, being used mainly for the sake of churning the economy and thus creating “economic growth.”
For instance, from Transport Fuel Rationing Part 3, about 60% of these "critical uses" involves transportation uses (truck, rail and other vessels), about 34% is for non-transport uses (mostly for industrial uses, followed by use as residential heating oil and then commercial uses) and the final 6% involves government use (federal, including military uses, as well as state and local government uses). But, as discussed above, of 1.7 bbs/yr used for food production—about 0.5 bbs/yr is basically spent shipping food around the country for on average 1500 miles. My hunch is that other goods are shipped over similar distances as part of these other "critical" transport uses of petroleum. Is this really "critical?"
And let’s not forget the energy and materials to manufacture and ship products around the world which are intentionally designed to fail and be replaced in a few years time. Go listen to The Light Bulb Conspiracy, an audio presentation brilliantly assembled by Upton at Unwelcome Guests. The 2-hour audio documents how “built-in obsolescence,” not just of incandescent light bulbs, but virtually every consumer product, was introduced, ostensibly to stimulate employment and the economy, during the great depression. Then go listen to part 2 of Homo Miserabilis which provides a radio adaptation to “Shop Til You Drop,” which also describes the marketing efforts to drive the world towards “conspicuous consumption.”
I suspect that the present churning of energy and material resources to give the appearance of “economic growth” is what really is gobbling up most of those industrial and commercial “critical use” portions of the 5 bbs/yr.
------------------------
Well, at 70 single-spaced pages, +50 figures and scores of tables produced over the course of two months, I see, in retrospect, that I should have divided this into two or three separate series. I doubt that there is anyone out there with the fortitude to actually get through all of this material. Probably not the best way to run a popular blog, but, here we are.
A complaint I sometimes see at other sites is readers asking for “proof” to support whatever proposition is being proposed. Hopefully, at least that is not a problem here—you are free to wallow around in the same data that I have spent hours looking at, in just as much detail as you can stand.
This is my 50th post! This has really become half-blog and half-online research log book to help me explore and document answers to questions that I just don't see adequately addressed anywhere else.
My hope is that you have found at least some of it useful.