Sunday, February 6, 2011

An Export Land Model Analysis for the USA-Part 3

In Part 1, I presented my best estimate Export Land Model analysis for the USA, based on my analysis of trends in petroleum production and consumption for the USA and its top ten import sources (“the top ten”). 

In Part 2, I examined pessimistic and optimistic Export Land Model scenarios based on alternative interpretations about the trends in petroleum production and consumption for the USA and the top ten.

Here in Part 3, I look at some implicit assumptions that are part of the Export Land Model analysis—assumptions about the fungibility of the exportable global supply of oil, assumptions about the behaviors of the top ten facing peak oil, and, assumptions about the ERoEI of the remaining oil supply. 

In Parts 1 and 2, I predicted that several of the USA’s top ten import source countries will hit net zero exports in the next twenty years.  Throughout this article, I will use the term “ex-exporter” to signify a previously net petroleum exporting country (i.e., a positive quantity from domestic petroleum production minus consumption) that has recently hit zero net exports. 

The Fungibility of Oil

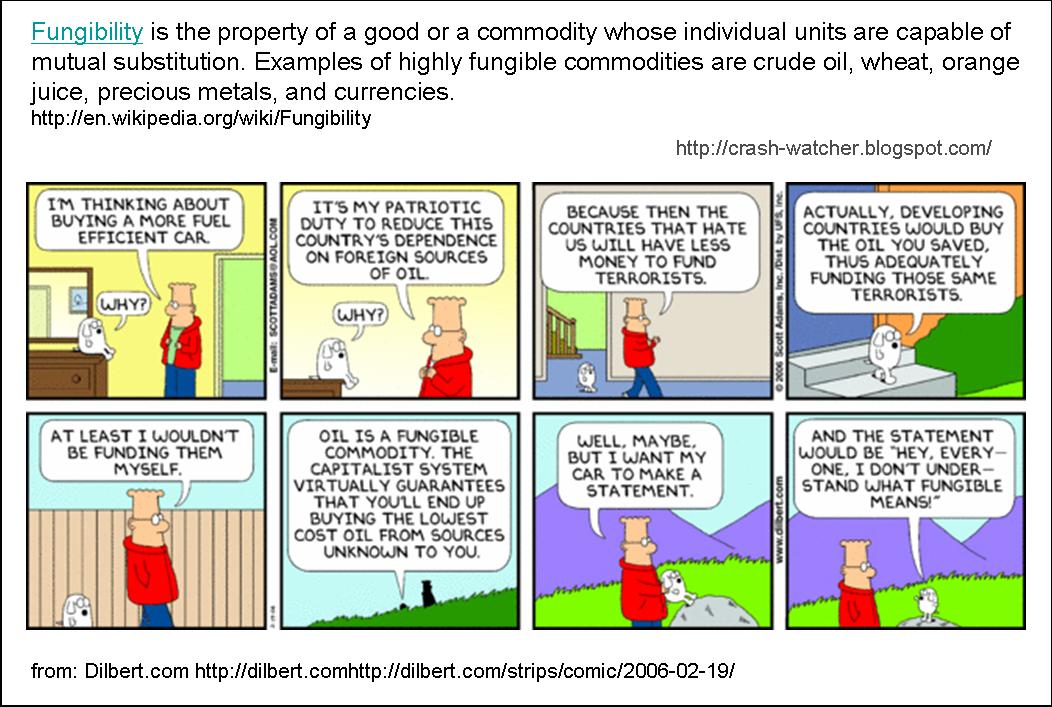
 It is probably a new low to be citing “Dogbert,” but I think the dog portrays the traditional view of oil about right: oil production from any source is assumed to go into one big “fungible pool” of world supply, and, the price of oil reflects the total demand for that supply.  If demand goes up, that drives up the price, which in turn, causes more oil to be extracted from an assumed, “endless” supply in the ground.

I think that this view is related to an assumption implicitly made in my Export Land Model analysis: once a top ten exporter to the USA hits zero net exports, it just “goes away” and imports oil from “somewhere else” or lives within its own production means.  This assumption means that these ex-exporters from the top ten do not draw into the remaining pool of exports that the USA is importing from. 

That could happen if the ex-exporters decide to start reducing their consumption to match their declining production—living within their own means, as it were.  It is much more likely, however, that the ex-exporters will try to transition into being net petroleum importers, just like most, if not all, ex-exporters in the past have done (e.g., the USA and more recently the UK, China, Indonesia, etc...). 

If there really was an “endless” supply of oil—or at least the top ten contributed a relatively minor amount to the global supply of exportable oil, then this assumption of fungibility would not be too important.  The USA could continue to get its imports from the remaining top ten, and my model’s prediction of USA consumption would remain undisturbed by the importing activities of the ex-exporters. 

Unfortunately, that is not case here because these top ten do make up a substantial fraction of the total world export supply. 

Just how much oil do the top ten contribute to the total world supply of exportable oil? 

Fortunately, a recent article by George Lordos titled, Net Oil Exports Will Drop To Zero Long Before Oil Production Does (a truism if I ever heard one) provided the number that I need to estimate just how much.  Table 1 of Lordos’s article indicates that the sum of net exports from all current (2009) exporters equaled 44895 kbd or 16.4 bbs/yr.  From my analysis in Part 1, I can calculate that the sum of the 2009 exporters from the top ten USA import sources equals 9.38 bbs/yr.  From this, I estimate that the top ten contribute 57% of the total world export supply. 

That is, the top ten suppliers to the USA, as a group, contributed more than half of the global supply of exportable oil.  To assume that an ex-exporter would not tap into a portion of the exports from the remaining top ten is tantamount to saying that this source of oil is not fungible.    Dogbert would have an issue with this, and I think he would have a point.

My Fungibility Assumption
Rather, if we assume that the exportable oil is “perfectly fungible,” then an ex-exporter from the top ten exporters who transitions into being an importer should get 57% of their imports from the remaining top 10.  That, in turn, would cut into the exports available for the USA to import. 

The same is actually true now for Canada, which, as I pointed out here, presently exports more (73% of its total production) than its net exportable petroleum to the USA, and therefore must also import petroleum from other net exporting countries.  If I assume “perfect fungible,” then 57% of the petroleum that Canada imports would come from the remaining top ten (my trend analysis for Canada already accounted for the petroleum that Canada gets back from the USA, corresponding to 12% of Canada’s consumption). 

Looking at the top ten as composite group
Before looking at the effects of fungibility, let’s first briefly review my previous best estimate Export Land Model analysis—except this time with a group perspective of the top ten import sources.

Figure 8 shows the sum of the reported production (light blue open circles), consumption (brown open circle) and the sum of report net exports (green open circles) from the top ten import sources to the USA, and, my corresponding prediction curves (solid light blue, brown and green lines) based on my best estimate assumptions, described in part 1.  Also shown for reference, is the reported production and consumption for the USA (solid blue and red circles) and my prediction curves (dark blue and red lines) for the USA, also described in part 1 (i.e., this is the same data shown in Figure 3 of part 1).

Figure 8 nicely illustrates how the sum of the predicted decline curves for exports (solid green line) is substantially steeper than the sum of the decline curves for production.  The steep rate of decline of the exports (about -5%/yr from 2010 to 2022 is due to the combination of decreasing production and increasing consumption by the top ten exporters, as a group. 

The sum of consumption from the top ten (brown line) looks like a straight +1.1%/yr increase from 2010 to 2030 (a 21% increase in consumption from 2010 over 20 yr; r2>0.99).  That’s because some of the top ten (e.g., Canada, Mexico, Russia, Brazil) were predicted to have flat or declining consumption over this period) while others (the remaining top ten) are predicted to have exponentially increasing consumption.  As a composite group, consumption gives the appearance of a linear increase.

The sum of net exports flattens out at 2023 because my assumption was that the ex-exporters just “go away,” and that the remaining exporters (mainly Canada, Iraq and Brazil) continue to export their respective same fractional amounts to the USA.

Quantifying the Effects of the Fungibility Assumption
To assess the effects of the fungibility assumption, I analyzed my prediction data for the top ten USA import sources in a way that considers the exportable oil from the top ten as a fungible sum that gets proportionately distributed to Canada and to the ex-exporters and then to the USA.  

Figure 9 shows the same data as in Figure 8, but now with fungibility considered quantitatively, as follows: 
1) I calculated that on average (from 1985 to 2009) 34.7 ± 0.05 percent of the sum of the reported exports from the top ten went to the USA.  I have assumed that this same percentage of 34.7% will continue to be exported to the USA going forward.
2) I assumed that 57% of oil imports are first distributed to Canada, and the ex-exporters, and then 34.7 % of the remainder goes to the USA.  I made this assumption because I wanted to see what the maximum impact of my fungibility assumption would have on the USA. 
3) As in Part 1, I assumed that US consumption can be estimated from the sum of US production plus net exports for the top ten, all divided by 0.86. 
In contrast to the predicted sum of net exports shown in Figure 8 (the red dashed line in Figure 9), the sum of net exports continues to decline after the inflection point at 2023, albeit at a slightly slower rate.  The reason for the continued decline is that, now, as the top ten exporters (i.e., Mexico, Venezuela, Saudi Arabia, Russia Angola, Algeria) drop out and are assumed to become importers, they draw 57% of their imports from the sum of exportable oil from the remaining top ten.  Additionally, 57% of Canada’s imports from the top ten draws from the sum of exportable oil is now considered. 

Consequently, there is less oil available for the US to import, and therefore, US consumption (solid red line) is lower than predicted in Figure 8. 

The effect of my fungibility assumption on the US consumption does not look that dramatic to start with, but then it becomes increasingly important in the 2020s.  For instance, by 2030, my estimate of US consumption (Figure 8 or Figure 9 dashed red line) is 4.11 bbs/yr, whereas with fungibility considered, my estimate of US consumption is predicted to be 30% lower, at 2.87 bbs/yr. 

My assumptions that the pool of exportable oil being first distributed to Canada and to the ex-exporters, and then 34.7 % of the remainder going to the USA, tends to  maximize the effects of the fungibility assumption on decreasing USA consumption.  I would expect that the reality would probably be somewhere between the solid red line and the dashed red line in Figure 9.

Figures 10 and 11 show the same analysis done for the pessimistic and optimistic estimates, respectively (corresponding to Figures 4 and 5, respectively, in part 2). 


Once again, these plots nicely illustrate how the declines in the sum of exports are steeper that the decline in production because rising consumption by the top ten, as a group, detracts from exports. 

For the pessimistic estimate, the rate of decline in the sum of exports from the top ten from 2010 to 2023 equals  -6.3 %/yr.  This decline rate is similar to the -6.2%/yr decline rate that was predicted by Brown and Foucher for the sum of the top five global exporters in 2007 (see e.g., Figure 17 in Quantitative Assessment of Future Net Oil Exports by the Top Five Net Oil Exporters).  The effect of the fungibility assumption on the pessimistic estimate is about the same as it was for my best estimate.  For instance, the USA’s predicted consumption by 2030 is about 30% lower if the fungibility assumption is made, as compared to if it is not made.  

For the optimistic estimate, after a very mild -0.9 %/yr decline in the sum of exports from the top ten from 2010 (10.6 bbs/yr) to 2026 (9 bbs/yr), the decline rate picks up to -4.8%/yr from 2027 to 2040.  The effect of the fungibility assumption on the optimistic estimate is milder than for the best estimate or pessimistic estimate.  For instance, the USA’s predicted consumption by 2030 is only about 7% lower if fungibility considered, as compared to if it is not considered.  

Can you see why fungibility is not as important for the optimistic estimate?

Until the top ten exporters become ex-exporters and start to import, they do not draw down on the exports from the remaining top ten.  Additionally, for the effect to be prominent, one needs large petroleum consumers transitioning from exporter to importer, because then the quantity of petroleum  imported will be large, and, growing ever larger.  For the optimistic scenario, only Venezuela, Russia and Angola hits zero net exports by 2030 (Algeria just starts to hit zero exports in 2030).  But only one these counties—Russia is predicted to be relatively heavy consumer when they hit zero-net exports. 

In comparison for my best estimate or pessimistic estimates, Mexico and Saudi Arabia, two relatively heavy petroleum consumers, are added to the list of ex-exporters in 2015 and 2023, respectively.   

The Behavior of the ex-Exporters
As discussed above, my fungibility assumption is that when their domestic consumption increases to the point where the exporters need their own oil for their own domestic use, they will stop exporting and start importing petroleum.

As recently pointed out by gail-the-actuary, in What Lies behind Egypt’s Problems? How do They Affect Others?,  the recent troubles in Egypt may reflect what happens when a developing country makes the transition from exporter to importer, with relative little else to support the economy when petroleum export revenues cease.  I suspect that a similar fate awaits many of the ex-exporters among the top ten.

Even after hitting, or approaching, zero net exports, exporters may still have to export because they can't refine their own oil, or, because they need the income.  Exporters know that there is a price to pay for shipping their oil to other countries to get refined—and that price is typically paid in a share of the oil itself.  Additionally, government revenues and the total GDP of many developing countries that are oil exporters rely heavily on oil exports.  Consider the top ten, for example.  The EIA country analysis briefs give the following percentages of total government revenues or total GDP that are based on oil exports:
Mexico—40% of government revenues,
Venezuela—50% of government revenues,
Nigeria—65% of government revenues,
Angola—80% of GDP;
Algeria—30% of GDP;
Iraq—66% of GDP;
Saudi Arabia—40% of GDP; and

Hitting net-zero exports will put these countries, like Egypt, in a very tough economic position.  I expect that at least some of them will have to continue exporting oil at the cost of limiting their own domestic consumption.  Limiting domestic consumption, however, will stifle the country’s ability to diversify its economy so as to be less dependent on oil income.  Civil unrest, and even regime change, is possible in such an environment.

Is Voluntary Conservation Realistic?— hypothetical scenarios for Saudi Arabia and Russia
Before hitting net-zero exports, wouldn’t it be rational for an “export land” to keep some oil in the ground for the use and prosperity of future generations?

There are some signs that at least some oil exporters are thinking of conservation:

"I keep no secret from you that when there were some new finds, I told them, 'no, leave it in the ground, with grace from god, our children need it'," King Abdullah said in remarks made late on Saturday, SPA said. 

Tom Petrie, vice president, Merrill Lynch:
“King Abdullah’s quote speaks to the fast-emerging reality of what I call ‘practical peak oil.’ The Saudis and other exporters are placing a new emphasis on elongating the petroleum exploitation and depletion cycle. This stems from a growing awareness of the challenges of conventional resource maturity, as well as rising resource nationalism. This is likely to result in an earlier occurrence of global peak oil output than many consumers yet recognize.”

Chris Skrebowski, editor of Petroleum Review:
“In any case, there is now a broad-based move by energy exporters, including Russia, Angola, Azerbaijan, and Norway, to restrict expansion to maximize plateau flows. If this takes hold, then global supplies will reach a peak rather earlier than analysis of future projects would indicate.”


If the Kingdom of Saudi Arabia or Russia, or others, try to cut back on their exports and conserve, they would have to do so very carefully so as not upset oil revenues and GDP by too much in any one year.  A major risk here, in my opinion, would domestic civil unrest.  If the world’s top two exporters, Saudi Arabia and Russia, did decide to conserve by limiting production, what would this look like, and, what affect might this have on US imports and consumption?

For instance, let’s say that King Abdullah and his Russian counterpart, Vladimir Putin, both ambitiously decide to reduce their rates of production from 2010 and forward, for the benefit of the next generation.  According to my analysis of the production data using the Hubbert equation, Q¥, the total recoverable petroleum equals 151.8 bbs and 85.6 bbs for Saudi Arabia and Russia, respectively.  By 2009, the remaining amounts yet to be recovered are predicted to equal 54.8 bbs and 36.7, respectively.  If this remaining oil was produced at a constant rate over the next 30 years from 2010 to 2040, then Saudi Arabia’s and Russia’s production would be reduced to 1.83 bbs/yr and 1.22 bbs/yr, respectively.  Those are 48% and 66% reductions in production compared to 2009 levels.

Russia could do this, in principle, because their consumption rate is predicted to be flat or declining (about 1 to 0.9 bbs/yr) over this period. 

Saudi Arabia, could not as easily do this, because their predicted exponentially increasing rate of consumption still drives them into net zero exports by about 2027—that’s only a four year reprieve compared to my original prediction of net zero exports by 2023.  To make this work for 30 years Saudi Arabia would also have to limit its domestic consumption rate to a number at or below 1.83 bbs/yr.  Let’s assume that they allow consumption to increase to 1.46 bbs/yr and ten freeze it at 20% below the 1.83 bbs/yr production rate.  At its present growth rate, Saudi Arabia will reach that level of consumption by 2020—this would still allow a 55% increase over 2009 levels. 

Figure 12 shows the effects that these assumption would have on the sum of the exports from the top ten and on USA consumption (solid red) as compared to my best estimate (dashed red line corresponding to the red line in Figure 8). 


It is apparent that the effect on USA consumption, as compare to my original best estimate, is quite minor. 

The reason why is clear: my original estimate includes the prediction that Saudi Arabia and Russia would hit zero net exports by 2023.  With the present conservation assumptions, Saudi Arabia and Russia actually have a slightly positive effect on US consumption after 2023 because these two countries continue to be net exporters.  But the relative amount of petroleum being exported is small and a still smaller fraction of this goes to the USA (about 18% and 8% for Saudi Arabia and Russia, respectively). 

As also shown in Figure 12, an immediate 48% (Saudi Arabia) and 66% (Russian) reduction in production in 2010 would not directly impact US consumption very much.   There is only a 6% larger drop in consumption as compared to my best estimate.

In contrast, these conservation measures would have a devastating effect on consumption in Europe and Asia, because this is where the bulk of Saudi Arabia’s and Russia’s petroleum is presently exported to.  For instance, according to the EIA’s country analysis brief for Saudi Arabia, 50% of crude oil and refined products goes to Asia, and about 10% goes to Europe.  According to the EIA’s country analysis brief for Russia, 81% of crude oil exports go to Europe, and 12% go to Asia. 

Therefore it is likely that austerity measures of the magnitude assumed here would crash the economies of Europe and Asia.  Of course, if my fungibility assumption holds, then this would indirectly impact US imports as Europe and Asia scour for alternative import sources to replace the difference. 

But could the governments of Saudi Arabia and Russia, as authoritarian as they are, really reduce their production by 48% and 66%?  I seriously doubt it. 

Reducing production by 48% and 66% would cause petroleum exports to drop by 85% and 93% for Saudi Arabia and Russia, respectively.  But, petroleum exports account for 40% and 20-25% of the GDP of Saudi Arabia and Russia, respectively.  Therefore cutting production would mean dramatic cuts to GDP.  For example, for this voluntary conservation scenario, Saudi Arabia’s GDP would be drop by 34% and Russia‘s GDP would drop 18-23%.   That would be enough to cause a serious economic recession in both countries. 

The governments that caused the recession would be facing serious civil unrest and protests—not unlike in Egypt presently.  In my opinion, neither government would be willing to risk this.

Conservation for the Exporting Developing Countries is Unlikely
For the same reasons, I expect that the developing countries among the top ten (Mexico, Venezuela, Nigeria, Angola, Algeria, Iraq) will not conserve, but instead, try to follow the same trend as earlier ex-exporters that became net importers.  That is, rather than conserve, they will just continue to export their oil and use the revenues to grow their domestic economy, this in turn, will cause the rate of domestic petroleum consumption to increase. 

After they reach peak production (“peak oil”) and then hit zero net exports, they will suddenly discover themselves to be net oil importers.  This may be tractable at first, because the relative amount of imports to total consumption would be small.  Consequently, domestic consumption rate will continue to increase.  At the point when there are not enough oil left from the remaining “export lands” to supply the increasing numbers of oil importing countries, domestic consumption rates will have to decline, globally. 

Those countries that can still produce a substantial fraction of their own oil will suffer less than those countries that have to import most or all of their oil.  Some former exporting countries that produce oil will still have to export oil in exchange for the things that they need (e.g., food, weapons, high-tech goods, refined petroleum products) and that will cut into government revenues and GDP.  Domestic civil unrest will be the likely result.

What about ERoEI?
ERoEI, or EROI (energy return on investment), is the ratio of the amount of usable energy acquired from a particular energy resource to the amount of energy expended to obtain that energy resource.

from Wikipedia, EROEI

Energy return on energy invested (ERoEI), like the Export Land Model, is a simple but important concept.  

Charles Hall, who takes credit for bringing the concept of ERoEI to the realm of petroleum production has succinctly pointed out that ERoEI is really just a “Best First” principle:

Humans use high quality, low cost resources before low quality, high cost resources

Charles A. S. Hall and Cutler J. Cleveland
Presented at ASPO -US conference Denver November 10, 2005
Available at Hall’s College of Environmental Science & Forestry website here.

That is, not all petroleum resources are the same: some require more energy to extract and refine than others.  The easy-to-extract oil is history and included in past production.  Now the world is left with the increasingly difficult—energy expensive—sources of oil to extract and refine.  The USA’s Bakken oil formation, the Alberta tar sands in Canada, and the sub-salt fields off the coast of Brazil, are all examples of the present and future petroleum resources that have a much lower ERoEI, than more traditional resources like the oil fields of Texas 50 years ago, or, of Saudi Arabia 20 years ago.

An equally important point raised by Hall is that:

The question is not how much oil is in the ground but rather how much can be gained with a significant energy profit (EROI)

Charles A. S. Hall Economic Implications of Changing EROI Ratios (slide 50)

At the point where the amount of energy expended to extract and refine the petroleum from any one petroleum resource equals or exceeds the amount of usable energy acquired, then production from that resource will stop.

I think that a pending example of this is corn-based ethanol production in the USA.  With an ERoEI of less than 2:1 (maybe 1:1 by some estimates!) the day that the Federal government stops subsidizing this industry, through grants, tariffs and import restrictions, is the day that the corn based ethanol production in the USA will stop (see A Bad Policy That Refuses to Die).

When ELM meets ERoEI—a Triple Exponential Effect
What effect does considering ERoEI have on the Export Land Model and how can we look at these two effects quantitatively?

To some extent, the Export Land Model should consider already at least a portion of the energy expenses associated with production.  A portion of domestic petroleum consumption will correspond to the petroleum directly expended on the recovery and refining of crude oil, tar sands, NGL etc...  But it is hard to determine was fraction of energy expenditure this corresponds to.  It is a daunting task to fully account for all of the energy expended on petroleum production.  Moreover, the ERoEI ratio would likely differ from one country to the next and from one petroleum resource to the next.

Therefore, in the analysis to follow, I have merely tried to assess the general effects of a declining ERoEI.  I did this by converting an assumed increase in the energy expended on production into equivalent barrels of oil and adding this to a country’s domestic consumption. 

Based on the estimates Hall presented EROI: definition, history and future implications  in the analysis to follow, I have assumed that the overall ERoRI ratio for both the USA and the top ten exporters will go from a present value of 20:1 to 2:1 over the next twenty years.  I also assumed that the rate of decline in ERoEI will be linear.  Specifically, I assumed that the ERoEI declines from 20:1 in 2010 at 0.9/yr to get to 2:1 in 2030.

For example, if in 2010, Saudi Arabia’s predicted production is 3.5 bbs/yr, then the additional consumption due to energy invested in production (in equivalent barrels of oil) is assumed to equal 0.18 bbs/yr (i.e., 3.5/20=.18).  If in 2030 Saudi Arabia’s predicted production is 2.7 bbs/yr, then the additional consumption due to energy invested in production (in equivalent barrels of oil) is assumed to equal 1.35 bbs/yr (i.e., 2.7/2=1.35).  These additional consumption estimates gets subtracted from Saudi Arabia’s production, along with other domestic consumption, to produce an ERoEO-adjusted net export rate for each year. 

As another example, if US production in 2010 is predicted to be 2.38 bbs/yr, then the additional consumption due to energy invested in production (in equivalent barrels of oil) is assumed to equal 0.12 bbs/yr (i.e., 2.38/20=.12).  If US production in 2030 is predicted to be 1.88 bbs/yr, then the additional consumption due to energy invested in production is assumed to equal 0.94 bbs/yr (i.e., 1.88/2=.94).  These numbers get subtracted from my previously predicted USA consumption  rate (i.e., USA production plus exports from the top ten, all divided by 0.86) to produce an ERoEI-adjusted predicted consumption.

Can you picture what my assumption of an annual linear decrease in ERoEI would have on additional energy consumption with time? 

Here’s some help, using the numbers from my best estimate predictions for USA production:

Yes, that right, yet another exponential curve!  The effect on added consumption really become prominent from 2027 on when the ERoEI drops below 5:1.

Similarly, the ERoEI-adjusted net exports from the top ten, as a group, are the sum of a triple exponential effect:  exponentially decreasing production; exponentially increasing domestic consumption, and, exponentially increasing energy expenditures to produce the petroleum. 

If you are getting the sense that this story will not end well for the USA’s petroleum consumption—then you are correct.  

Figure 14 shows the effect of my ERoEI assumption as applied to my best estimate assumptions about production and consumption for the USA and the top ten.  Figure 14 shows the same data as in Figure 8, except that now, from 2010 and on, the energy expenditures on petroleum production are added to the sum of predicted consumption for the top ten, which in turn gets subtracted from net-exports.  Plus US consumption is reduced by the added amounts of energy expended on domestic production.

The most noticeable difference compared to Figure 8 is that exports and US consumption tail off  for a much short period after 2022 and then start to curl down.  For instance, now, instead of a fairly lengthy plateau in net-exports from 2023 to 2030, net-exports plateau for about 5 years and then curves down towards zero as the ERoEI drop to less than 5:1 in 2027.  It looks like net-exports would hit zero shortly after 2030.  Additionally, now from 2010-2022 instead of a -5%/yr decline in net exports we have a 6%/yr decline. 

Combining ELM, Fungibility and ERoEI assumptions—off with their tails!
My original Export Land Model analysis assumed that the ex-exporter simply “go away” and either live within their own production means, or, import oil from countries other than the top ten.  Figure 9 shows the correction for this effect by assuming that a 57% fraction will come from the remaining exporters of the top ten.

Figure 15 show what happens if we add my ERoEI assumption to the fungibility-corrected exports.  Now neither sum of exports nor US consumption have any tails.

Rather, the sum of exports from the top ten, as a group, are on a steady -6%/yr decline until hitting zero net exports in 2027.  At this point, I assume that the USA is on its own and now is forced to live within it own means of producing petroleum.  But by then, the ERoEI is headed toward 2:1 and by 2030, the USA’s predicted effective consumption is predicted to equal about 1 bbs/yr.  That’s about half of the USA’s production rate of 2 bbs/yr—at a ratio of 2:1, the other half is expended on production.  Thereafter, if the ERoEI stabilized at 2:1, and if the USA didn’t export any petroleum, then US consumption would also stabilize at about 1 bbs/yr.

 
Alright, that is it!  In the fourth and final part of this series, I will give a summary of the results of this analysis and discuss what implications this has for the USA and globally.

Saturday, January 29, 2011

An Export Land Model Analysis for the USA-Part2


...it becomes difficult to imagine that global oil production could gently waft down from lofty heights in a graceful smooth and continuous curve spanning decades. Rather, the picture that presents itself is one of stepwise declines happening in more and more places, and eventually encompassing the entire planet.

Dmitry Orlov, Peak Oil is History

In Part 1, I presented my best estimate Export Land Model analysis for the USA, based on my analysis of trends in petroleum production and consumption for the USA and its top ten import sources.  In the article I laid out my explicit assumptions.

Here, in Part 2, I examine some different possible future scenarios, based on alternative pessimistic and optimistic assumptions about the trends in petroleum production and consumption for the USA and its top ten import sources.

Warning 
If you are the type of person whose hates the feeling of cognitive dissonance, you may not enjoy this article.  I explore several different possible future scenarios here (and still more in part 3), and, when you get through them all, you might feel more confused than ever about what might happen to the USA's consumption in the future.  If you are looking for: “And that's the way it is,” you may find this article troubling—but I encourage you to work through it nevertheless.

I presented in part 1 my best estimate of what I believe to be most likely trend of future USA consumption—but I readily admit that I might be wrong (in either direction!), and, I am willing change my view if I find compelling evidence to do so.    Part of having the flexibility of mind to do so comes from thinking through alternative scenarios, such as presented here.   Try it and you will understand the issues better, I think.

I don't think that any of the following assumptions are, by themselves, ridiculous, because there is some support either in the production data itself, or, for geopolitical reasons.  In my opinion, however, it is unlikely that these would all happen together.  Nevertheless, I believe that exploring the plausible extremes of pessimism and optimism help to set outer boundaries on what we can expect going forward.

Pessimistic Export Land Model Estimate—why you should prepare for hard times
Figure 4 below shows the Export Land Model analysis, analogous to that shown in Figure 3 in Part 1, but with a few key assumptions shifted towards the pessimistic side:

1) USA—no change in assumptions.

2) Canada only sends its net exports to the USA. Canada's production is still assumed to increase, as represented by the modified Hubbert equation fit to the 1980-2009 production data. This could happen if, for example, because of global oil shortages, Eastern Canada was no longer able to import petroleum from Europe, Africa and the Middle East.  

3) Mexico—no change in assumptions (i.e., still no net exports by 2015). 
 
4) Venezuela—no change in assumptions (i.e., still no net exports by 2023). 

5) Saudi Arabia—no change in assumptions (i.e., still no net exports by 2024). 

6) Nigeria's production follows the trend represented by the Hubbert equation fit to its more recent 2002-2009 production data, and, Nigeria continues to send 53% of its net exports to the USA (i.e., now no net exports by 2018).  This could happen if, for example, civil unrest and militant attacks increase, and/or, foreign investments don't occur to increase or maintain production.


7) Russia's production continues to follow the trend represented by the Hubbert equation fit to the 1999-2009 production data, but Russia stops its linear increase in the percentage of exports to the USA.  That is, exports remain fixed at 2009 levels of 8%.  I still assume that Russian domestic consumption stays flat (i.e., still no net exports by 2022, but not increasing amounts of exports to the USA up to that point). 

8) Algeria—no change in assumptions (i.e., still no net exports by 2030). 

9) Angola's production increases at “only” 24 %/yr and its ultimately recoverable petroleum equals only 11.5 bbs, as represented by the unconstrained Hubbert equation best fit to the 2001-2009 production data. I still assume that Angola continues to send at least 24% of its net exports to the USA (i.e., this still results in no net exports by 2025, but in lesser quantities). 

10) Iraq's production continues to follow the trend represented by the Hubbert equation fit to the 2003-2009 production data (this was scenario 1 in my original trend analysis for Iraq; i.e., now, no net exports by 2030).  This would be consistent with Iraqi's recent history of periodic recoveries and war, and/or with a lack of foreign investments.  I still assumed that Iraq's domestic consumption follows the upward trend represented by the Hubbert equation fit to 2003-2009 consumption data, and, that Iraq continues to send at least 26% of its net exports to the USA.

11) Brazil—no change in assumptions.


A large part of the steep decline in Figure 4 at 2010 is due to my pessimistic assumption made that Canada starts to send only it net exportable petroleum to the USA.  That amounts to a minus 0.4-0.5 bbs/yr difference, as compared to my best estimate model shown in Figure 3.  As I have already explained in Canada—Petroleum Superpower or Super-slave? this would be difficult for Canada to do.  But, if over the next decade or so Venezuala, Saudi Arabia, Russia, Angola, Algeria etc..., all have no net exports, then where would Canada import its oil from in order to make up for the extra quantity, over its net exports, that it presently exports to the USA?  At some point in time in this scenario something like this would happen—but probably it would play out on a more gradual timeframe than depicted in the figure.

According to this "pessimistic scenario," the annual decline in production from 2011-2021 is in the 4-5 %/yr range, instead of 3-4 %/yr, as compared to the best estimate model.  Consequently, there is a 29% decline from 2005 to 2013, and another 23% decline from 2013 to 2021.  That's a 52% drop over 16 years

This is still not as severe a decline as what Russia experienced in the early 1990s, but substantially more severe than my best estimate shown in Figure 3.  As before, there are no prospects for an upswing through the 2020s and beyond—just a shallower rate of decline.  According to this scenario, by 2025, the only two significant import sources to the USA would be from Canada and Brazil.  

Optimistic Export Land Model Estimate—you should still prepare for hard times
Figure 5 below shows the Export Land Model analysis, analogous to that shown in Figure 3 in Part 1, but with a few key assumptions shifted towards the optimistic side:

1) USA—the rate of decline in domestic production in the USA stabilizes and remains roughly constant, as represented by the sum of the Hubbert equation and modified Hubbert equation fits to the different components of production (the stabilization is mainly due to increases in NGL production, see Figures 7 and 9 in Trends in USA Petroleum Production and Consumption.

2) Canada—no change in assumptions (i.e., the same continued trend of increased exports).

3) Mexico—production follows the longer term trend represented by the modified Hubbert equation fit to the 1987-2009 data (this was depicted as the dashed green line in Figure 4, here).  This may happen, for example, if alternative production sources (e.g., KMZ and others) are developed in time to mitigate the decline in the Cantarell field (i.e., now net exports continue past 2030). 
 
4) Venezuela—no change in assumptions (i.e., still no net exports by 2023). 

5) Saudi Arabia—production is assumed to stay constant at 3.847 bbs/yr (the average value of production from 2003 to 2009)—at least until 2030 (this was depicted as the dashed green line in Figure 3, here).  Domestic consumption still assumed to continue its exponential increase, and Saudi Arabia is still assumed to send 18% of its net exports to the USA.

6) Nigeria—no change in assumptions (i.e., still no net exports by 2039). 

7) Russia—no change in assumptions (i.e, still no net exports by 2023). 

8) Algeria—no change in assumptions (i.e., still no net exports by 2030). 

9) Angola—no change in assumptions (i.e., still no net exports by 2025). 

10) Iraq's production is assumed to explode upwards as represented by the Hubbert equation fit to 2003-2009 production data and assuming the production rate increases 17.5 %/yr and the ultimately recoverable petroleum (Qº) of 115 bbs (this was scenario 2 in my original trend analysis for Iraq).  This could happen if Iraq remains politically stable, the foreign investments come through, and, the projected quantity of oil really is in the ground (i.e., Qº = 115 bbs). I still assume that Iraq's domestic consumption follows the upward trend represented by the Hubbert equation fit to 2003-2009 consumption data, and, that Iraq continues to send at least 26% of its net exports to the USA.

11) Brazil—no change in assumptions (i.e., the same continued trend of increased exports).


The predicted consumption curve actually tracks pretty closely to the Hubbert equation best fit to the USA’s 1984-2009 consumption data (originally presented in Figure 10 here), a portion of which  I depict in the figure (dash red line). 

The predicted consumption curve might be characterized as a type of "rosy peak oil scenario," such as described in Orlov’s article, with a gentle wafting down in production, and, US consumption following suit.  For this scenario, however, the “wafting” would not last for decades, but rather, about one decade. 

According to the "optimistic scenario," the annual decline in production from 2010-2021 is predicted to be quite modest at less than 1%/yr.  That is less than the rate of decline in the past few years (i.e., about 9% since 2007). Production actually picks up slightly from its 2009 levels, and consequently, the total decline in the consumption rate is only 8% from 2005 to 2013, followed by and additional 5% decline from 2013 to 2021.  That's only a 13% drop over 11 years. 

The annual rate of decline in consumption does not steepen by more than -1%/yr until 2028.  Thereafter, throughout the 2030s, the consumption rate declines at a steeper rate of about 2-3 %/yr.  That steepening decline occurs for a few different reasons.  One reason is that assumed exponential increase in domestic consumption eventually takes out all of Saudi Arabia's production.  That is, despite an assumed continued production rate of 3.847 bbs/yr, Saudi Arabia's net exports still goes to zero by 2043.  Additional reasons are that Mexico's and Iraq's production start to go into steep decline through the 2030s, and hence, their net exports decrease even more rapidly.  

By 2040, USA consumption is predicted to be 64% of its peak consumption in 2005—a 36% drop over 25 years.

In summary, the USA consumption decline is delayed a decade and then the consumption decline from 2030 to 2040 is slightly milder than the predicted decline from 2010 to 2030 as depicted for my best estimate scenario in Figure 3.   The difference in the consumption decline curves in Figure 3 compared to Figure 5 is mainly due to the optimistic production assumption for Iraq.  Iraq's assumed enormous increase in production helps mitigate the declining exports from several other countries that are headed towards zero net exports by 2030 (e.g., Venezuela, Russia, Angola, Algeria).

What is most striking about the "optimistic scenario” presented in Figure 6 is that the USA’s consumption is still predicted to decline.  This is despite the optimistic assumptions that: the long-term decline in US production stabilizes, Mexico pulls out of its death-spiral of production decline, Saudi Arabian production does not decline at all, and, Iraq undergoes one of the most dramatic increases in production the world has ever seen.  We are talking here about Iraq's production rate from 2020 to 2030 eclipsing that of Saudi Arabia's assumed continued high rate of production.  Add to that my original assumptions of continued increases in production and exports from Canada and Brazil.  Despite all that “rosy” thinking, there are still not enough net exports from the top ten to put the USA’s consumption above its peak in 2005.  Just stop and think about that for minute.

Now, consider this: what would it take for there to actually be a growth in consumption—that is, a return to the consumption rate of 2005 and higher?

A "Sunshine and Lollipops" Export Land Model Estimate—a return to "normal" growth
To get the USA's consumption back to and above its all time 2005 high, I assume that USA, Mexican and Saudi Arabian production has stabilized, and, that there is continued growth in production (and exports to the USA) from Canada, Iraq and Brazil, as described above for the Optimistic Export Land Model Estimate.

Additionally, I assume that the trends of declining production from Venezuela, Russia, Angola, Algeria and Nigeria all stop and stabilize. Specifically, I have assumed that production, and exports to the USA, from Venezuela, Russia, Angola, Algeria and Nigeria all stay at their respective 2009 levels throughout 2010-2040. 

Figure 6 shows what this fantastic scenario would look like:

According to this "super optimistic" scenario, the peak in the USA’s consumption rate occurs in 2024 at 7.94 bbs/yr, which is about 4.5% larger than the peak in 2005.  Not surprisingly, the predicted peak in consumption in 2024 coincidences with the peak in Iraq's exports.  After that, Iraqi exports go down, mainly because Iraq's production goes into decline.  By 2036, the USA's consumption rate is back down to 2009 levels (about 6.9 bbs/yr). 

Based on this, I characterize this "super optimistic" scenario as predicting enough oil for a slight uptick in consumption over the first half and then a slight downtrend for the second half of a 25 year period.

There is one big problem with this scenario—it is a fiction at the moment.   I see no evidence in the production data to support the assumptions that the predicted production declines for Saudi Arabia, Venezuela, Russia, Angola, Algeria and Nigeria would all stop and stabilize. 

There is some hope, however, that the decline curves for these countries will not be a steep as represented by Hubbert equation fits to these data. 

As shown in my analysis of the US production data, the decline side of the production curve did not follow a simple logistic curve very well (see e.g., Figure 1 here).  Rather, the decline-side of the production curve, as modeled using the modified Hubbert equation, was more consistent with a steady increase in the fraction of recoverable oil (i.e., Q¥ ).  That increase corresponds to an about 0.53 percent increase per year (in the vernacular of the modified Hubbert equation, fcq = 1.0053).   This is probably reflecting improvements in the technologies of recovery or refining over the long period of the USA’s decline curve. 

It is possible that the decline side of the production curves for one or more of Saudi Arabia, Venezuela, Russia, Angola, Algeria, Nigeria, Brazil or Iraq will be similar to the USA’s.   For example, if hydraulic fracturing technology is brought to these countries, it might mitigate the steepness of the decline-side of the production curve. 

My trouble is that all of these countries are either in the early stages of decline or still on the growth-side of the production curve, and therefore I can’t apply the modified Hubbert equation to fit the decline side of the production curve. 

But, even if these countries all follow more of a USA-style decline side production curve, that still would not mean constant production for 30 year, as I assumed for the exports portrayed in Figure 6.  Rather, the production rate would decline, but at a more gradual rate than modeled using the traditional Hubbert equation.  This, in turn, should slow the rate of decline in exports as compared to Figure 3. 

For example, according to this USA-style production decline scenario, net exports for Saudi Arabia would probably hit zero somewhere between 2023 (as predicted assuming a declining production curve that follows the Hubbert equation—the solid green line in Figure 3 here) and 2044 (as predicted assuming a constant production rate—the dashed green line in Figure 3 here).  As this pertains to USA consumption, I picture in my mind something half-way between Figure 6 and Figure 3. 

Nevertheless, I think that Figure 6 is still useful for illustrating just what it would take to have a modest increase in consumption, similar to what we saw over the 25 year period from 1982 to 2007.  It seems unlikely to me that the days of “normal” growth are coming back, however.

Optimist-lite
And what if Iraq is not able to boost its production as hoped for and predicted by some analysts and the Iraqi's?  What if instead, Iraq is only able to maintain its present production at about 1 bbs/yr, but, all the other optimistic assumptions represented in Figure 5 still apply?  

Welcome to optimist-lite—really Iraq-lite, to be more specific.

The prediction for an “optimistic-lite scenario,” shown in Figure 7 below, is that the USA's predicted consumption curve is apparoxiamtely inverted, as compared to that shown in Figure 5.  That is, as shown in Figure 7, from about 2016 to 2025, the consumption rate declines at about 2-3 %/yr, and then, from 2025 on, the consumption rate decline is shallower at less than 1 % /yr.  

By 2040, the USA's consumption rate is predicted to end up at 62% of its peak in 2005—a 38% decrease over 25 years.  That’s about the same total decline as predicted under the "optimistic scenario" shown in Figure 5—it’s just that the decline pathway takes on a more near-term pessimistic shape.

These various optimistic outlooks all rely heavily upon the hoped-for bounty of massively increased oil production from Iraq and/or continued stable production from a number of the USA's top 10 import sources.  If the Iraq bounty is realized, then it probably will allow the USA to stumble along with a modest annual declining rate of consumption for another decade or so before succumbing to the about same decline as predicted in my best estimate presented in Figure 3 of Part 1.  

In Part 3, I will explore some implicit assumptions that are buried in this Export Land Model Analysis: fungibility, what happens to the exporting countries, and ERoEI.