As I discussed in Where in the world does the USA import its oil from? Algeria is number seven on the list of largest petroleum provider to the USA in 2009 based on data from U.S. Total Crude Oil and Products Imports (“Total Imports”).
According to the EIA’s country analysis brief for Algeria, the State-owned entity, Sonatrach, controls the oil and natural gas sectors in Algeria, and foreign companies have to enter into partnership agreements with Sonatrach to develop Algeria's oil fields. The EIA country analysis brief indicates that Algeria’s plan is to maintain crude oil production capacity at about its current level, and points hopefully to Sonatrach’s announcement of the discovery of 16 oil fields since the beginning of 2009 as a sign that this will help replace declines in older fields.
However, also in 2009 we have Algeria’s Oil Minister announcing the plan to go look for oil and gas in shale and compact formations “to ensure a safe and durable supply of hydrocarbons and petrochemical products to our traditional partners in Europe, Asia and North America.” (from: Algeria Looking for Shale Gas Deposits, Study Nuclear Power, Minister Says)
To me, this looks like a sign that conventional oil is at or near peak and that now the less attractive sources such a shale oil, requiring substantial foreign investments, is what will be in store for Algeria’s future production.
According to the EIA country analysis brief, Algeria’s exports are split between about one-third going to North America (the USA and Canada) and two-thirds going to QECD countries like France, Germany, Italy, UK, Japan and South Korea:

The USA was the biggest single country importer, taking about 27% of Algerian net exports in 2009.
The EIA's Algeria energy profile and “Total Imports” indicates that Algeria’s exports to the USA have trended upwards since at least the mid 90s:

The upward trend, however, is not very strong (linear regression r2 = 0.5). Therefore for the export analysis to follow, I have assumed that the percentage of Algeria’s exports to the USA will continue at its past 5-year average of 30.5±4 percent.
Non-linear least squares (NLLS) analysis of total petroleum production
Figure 1 shows total petroleum production for 1965-2009 as reported in the BP statistical review.
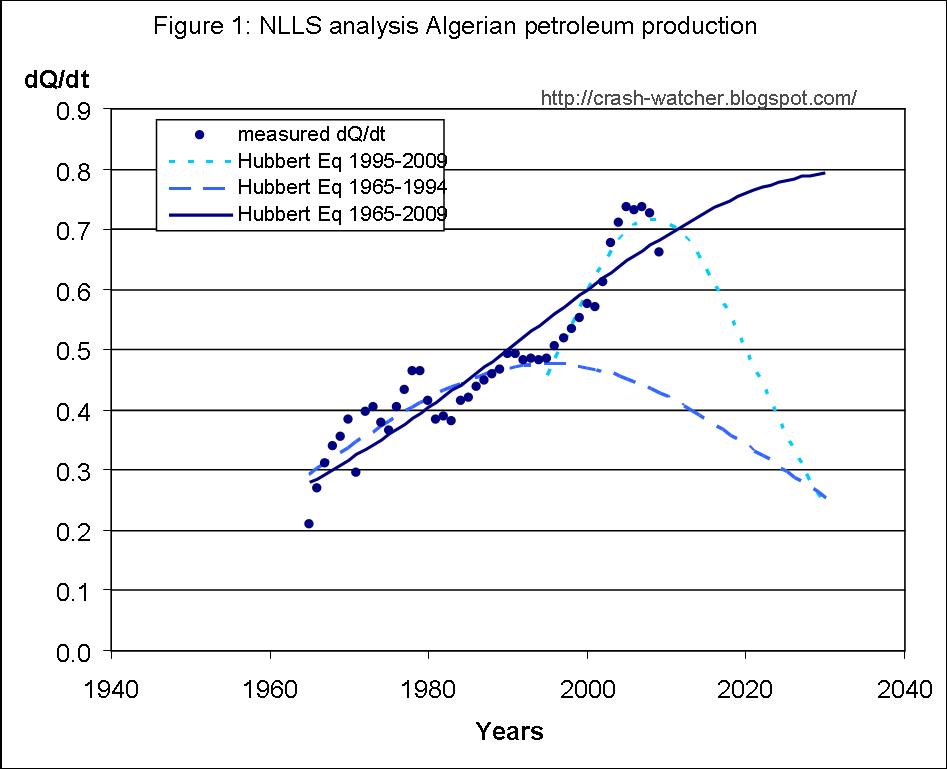
After a gradual increase in the production rate through the 1970s and 80s, production peaked in the early 90s and then took off in the late 90s until about 2004, where production plateaued for about four years and then declined in 2009. The EIA might want to write-off that decline in 2009 to OPEC quota restrictions, but that would not explain why there was a plateau in production from 2004 to 2008 when world oil demand was high and prices were rising. Again, to me this looks like a sign of a production peak.
Figure 1 shows the best fit of the Hubbert equation to the entire data set (solid line best fit parameters: “a” = 0.0326; Qo = 9.33; Q∞ = 97.51). This didn't look like a very good fit to the data as a whole, and so I tried two more Hubbert equation fits to two different smaller time segments: 1965-1994 (long dashed line, best fit parameters “a” = 0.04790; Qo = 7.44; Q∞ = 39.83) and 1995-2009 (short dashed line, best fit parameters “a” = 0.105; Qo = 9.33; Q∞ = 27.24). As suggested by the difference in value of the rate constant "a" for these two periods, there was a more than a doubling in the production rate from the 1965-1994 period to the 1995-2009 period.
I also tried a fit using my modified Hubbert equation 9 to the 1995-2009 time span, in which parameters “a” Qo and Q∞ were fixed to the best fit parameters for the 1965-1994 time span, and one or both of fca or fcq were varied.
Figure 2 shows the best fit for the case where fca was allowed to vary and fcq was fixed equal to 1:

The best fit value for fca was 1.043 (solid green line). Allowing only fcq to vary gave a poorer fit, and allowing both fca and fcq to vary did not result in a significantly better fit (F-test, p>.1). This suggests that the behavior of Algerian production since 1995 is most consistent with an about 4.3 percent per year increase in the production rate with no increase in Q∞. That is, it looks like Algeria
The best fit using modified equation 9, however, did not give a better fit than the Hubbert equation fit to the 1995-2009 time period so I will stick with the Hubbert equation fit for the further analysis to predict future exports. I note however, that as illustrated in Fig. 2, these two fits for the 1995-2009 period (solid green and short dashes) are nearly identical, so it would not have mattered too much which one I had chosen to use for my export analysis.
Non-linear least squares (NLLS) analysis of total petroleum consumption
Figure 3 shows the Algerian consumption data from 1965 to 2009 as reported in the BP statistical review:

The first thing to note about this plot is that the vertical scale here is about an order-of-magnitude lower than the scales shown in Figures 1 and 2—that is, Algeria doesn’t use much of the petroleum it produces. However, after a plateau in the mid 90s and then down turn in the late 90s, consumption took off in strong upswing through the 2000s.
That upward swing in the last decade causes the Hubbert equation to the full data range (solid line in Figure 3) to be quite a poor fit. The Hubbert equation fit to the smaller period from 1965-1996 (long dashes best fit parameters: “a” = 0.130; Qo = 0.067; Q∞ = 2.34) was much better, however.
To better model the consumption trend from 1997 to 2009, and beyond, I again turned to my modified Hubbert equation 9, setting “a” Qo and Q∞ to the best fit parameters for the 1965-1996 time span and allowing one or both of fca or fcq to vary.

Figure 4 shows the fit results for the case where fcq equal to 1.04 and fca fixed equal to 1. The overall best fit to the 1965-2009 time span using the Hubbert best fit parameters for 1965-1996 plus the modified best fit for 1997-2009 tme span (sum of rss = 0.0007) was significantly better (F-test p<0.0001) than the fit obtained using the Hubbert equation for the full 1965-2009 time span (rss = 0.0117). Allowing fca to vary and fixing fcq=1, did not result in a better fit, and varying both fca and fcq did not result in a significantly better fit (F-test, p>.1).
The value of fcq equal to 1.04 is consistent with the Q∞ for consumption increasing at a yearly rate of 4%/yr for the period 1997-2009. I extended this trend out to 2030 in Figure 4 to illustrate that, although domestic consumption has been fairly low in the past, it will start to more substantially eat into production in the future if the consumption trend continues.
Predicting future trends in Algerian petroleum exports
Figure 5 shows the production and consumption data from 1965-2009 and the best fits obtained using the modified Hubbert equation analysis of the 1997-2009 time period of consumption data and the Hubbert equation fit to the 1995-2009 period of production data.

Additionally, I show the estimated “measured” export data from 1997-2009 (i.e., the BP statistical review reported production rate minus the reported consumption rate).
The predicted production and consumption trends suggests that Algeria’s net exports would end in 2029, due to combination of declining production and increasing domestic consumption.
Impact on USA
Figure 6 reproduces the USA production and consumption trends, plus the previously discussed top-six petroleum exporters to the USA measured and predicted future exports as presented in the previous article, Trends in Russian Petroleum Production and Consumption.

Based on the predicted export trend, Algeria’s exports to the USA by 2015 is predicted to equal about 0.151 bbs/yr and only 0.102 bbs/yr by 2020. That is 91% and 62%, respectively, of Algeria’s estimated exports to the USA in 2009 (0.162 bbs/yr). If the trends continue, somewhat similar to Nigeria, Algeria will continue to be an increasingly important exporter to the USA in the 2010s, overtaking Mexico by 2012 and Russia by 2018 in terms of its exports to the USA, before dropping to very low levels of exports by the mid 2020s, and none by 2029.
Algeria adds another small sliver of petroleum to the USA's total import sources, at least until 2029.
No comments:
Post a Comment
Your comments, questions and suggestions are welcome! However, comments with cursing or ad hominem attacks will be removed.