Sunday, May 15, 2011

Part 8: Searching for evidence of population decline during periods of declining petroleum consumption


Well, it is good to be back—blogger lives!

In part 7, I examined the correlation between global population and petroleum consumption and presented  two possible scenarios for population change in light of declining petroleum production.   The first scenario (Figure 25, Part 7) posited a continued increase in population even in the face of the predicted decline in petroleum production decline, with a subsequent population decline, perhaps after the mid-century.  The second scenario (Figure 28, Part 7) posited a decline in population, “a die-off,” starting now in direct step with the predicted decline in petroleum production. 

Here in part 8, I present the evidence that caused me to reject the second scenario.

Perhaps you will be surprised, but there is plenty of evidence to show that the population can increase even in the face declining rates of global petroleum production or regional petroleum consumption.

Evidence of continued global population increases in the face of declining petroleum consumption in the early 1980s

For instance, Figure 29 revisits the relationship between global population and global petroleum production from 1950 to 2009 previously presented in Figure 27.   This time, however, I focus on the period from 1979-1982 (corresponding to the period of the 1979 energy crisis and the Iranian Revolution) when global production/consumption declined by about 14 percent. 

 Nevertheless, the global population still increased during this period by 235 million (4.54 billion to 4.86 billion).  

Table 14 shows the results of a linear regression analysis population versus time to estimate the global annual population change (i.e., the slope; r2 = 0.99 or higher for all periods) for the three periods in Figure 29 where petroleum production/consumption was either increasing or decreasing:


Table 14: Rate of global annual population change for periods of increasing and decreasing petroleum production rates
Range
Petroleum Production rate trend
Population change (millions / year)
1950-1979
increasing
64
1979-1982
decreasing (-14%)
78
1982-2009
increasing
79


As you can see, the 14 percent decline from 1979-82 appears to have no effect on decreasing the population growth rate.  Rather, the growth rate actually increased relative to rate during the preceding period from 1950-1979.  Then, even though production/consumption rates increased after 1982, the population growth rate stayed the same.

Okay, you might say, “maybe we aren’t seeing a population decline because the world is not as dependent on petroleum-driven food production as more developed regions like North America or Europe?”

No, there is still no support for population change being linked to petroleum consumption in these regions, at least not since 1965. 

Evidence of continued regional population increases in the face of declining petroleum consumption in North America (NA) and Europe (EU)

Figures 30 and 31 shows the analogous plots for NA and EU, of population versus petroleum consumption rates from 1965 (which where the BP statistical review data set starts).  There are two longer periods of production rate increase from 1965-1978 and 1983-2006, and two shorter periods of production rate decline from 1979-1983 and 2006-2009.  Table 15 summarizes the population growth rates (millions/year, mil/yr) during each of these periods.
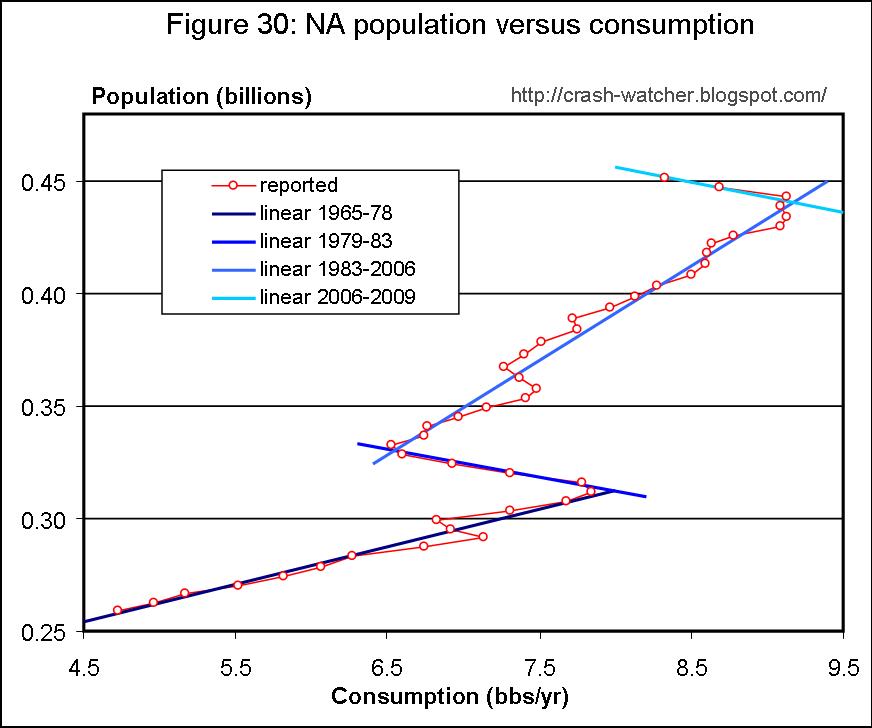


Table 15: Rates of regional annual population change for periods of increasing and decreasing petroleum production rates in North American and Europe
Range
Petroleum consumption rate trend
NA Population change (mil/yr)
EU Population change (mil/yr)
1965-1979
increasing
4.10
3.25
1979-1983
decreasing (-16% NA; -18% EU)
4.22
1.97
1983-2006
increasing
4.77
1.20
2006-2009
decreasing (-9% NA 5% EU)
4.33
1.43


From 1979-83, relative to their respective previous periods, for NA, with a 16% decline in consumption rate, the population growth rate increased slightly, while for EU during the 18 % decline in consumption rate, the population growth rate decreased.  However this population decline in EU continued during the subsequent period from 1983-2006 when the consumption rate increased and then decreased from 2006-2009.  The decline in the population growth rate in EU appears to be unrelated to these changes in the petroleum consumption rate.  In contrast for NA, during these same periods (1983-2006 and 2006-2009) the population growth rate remained comparatively constant.


Note, however, throughout all of these periods we are still seeing a positive population growth rate.  That is, the population in these regions continues to increase.

Alright, you might say, “maybe we aren’t seeing a population decline here because the relative change or duration of the periods of the petroleum consumption rate decline were not long enough to affect petroleum-driven food production?” 

No, that’s not it either...

Evidence of continued regional population increases in the face of large declines in petroleum consumption in the Former Soviet Union (FS)

Figure 32 shows the plot of population versus petroleum consumption rate for the FS.  Table 16 shows the annual population change for the periods shown in the figure and discussed below.


Table 16: Rate of regional annual population change for periods of increasing and decreasing petroleum production rates for the Former Soviet Union
Range
Petroleum consumption rate trend
Population change (millions / year)
1965-1979
increasing
2.35
1989-1990
flat
2.35
1991-1999
declining (-54%)
-0.13
2000-2009
increasing
-0.61


After a steady climb from 1965 to 1979, from 1980 to 1990 the consumption rate stopped increasing and remained flat in a narrow range around 3.1 bbs/yr.  The population during this period continued to increase at about the same annual rate.

Then, from 1991to 1999, there was a dramatic decline in consumption (corresponding to the dissolution of the Soviet Union) from 2.98 to 1.36 bbs/yr—a 54% decrease in 9 years! 

However, the annual population growth rate was essentially flat (-0.13 mil/yr).  Moreover for the first 5 years during this period, the period with the greatest decline in consumption rate (a 48% decrease by 1995 compared to 1990 levels), the population change was still positive (+.19 mill/yr).  Since 2000, there is a trend for a steeper negative population growth rate.  But, this is occurring while petroleum consumption rates have increased by 9% in 2009 compared from the rate in 2000.   Once again, these trends don’t support the notion of population change being linked to petroleum consumption rates.

Okay, okay, you might say, “maybe we aren’t seeing a population decline here because we need to look at petroleum rate consumption declines in developing regions, not developed regions?”

Closer, I believe, but still, there is no evidence to support this.

Evidence of continued regional population growth rate increases during period of petroleum consumption rate decline in South America (SA) and Asia Pacific (AP)

Figures 33 and 34 shows the respective plots of population versus petroleum consumption rate for the SA and AP, and Table 17 shows the annual population change for the periods shown in the figures and discussed below.


Table 17: Rates of regional annual population change for periods of increasing and decreasing petroleum production rates in South America and Asia Pacific
Range
Petroleum consumption rate trend
SA Population change (mil/yr)
AP Population change (mil/yr)
1965-1979
increasing
5.80
45.8
1979-85 (SA);
1979-82 (AP)
decreasing (-5.5% SA;
-9.7% AP)
6.41
45.23
1986-2009 (SA);
1983-2009 (AP)
increasing
6.12
44.6


SA and AP also experienced brief periods of mild consumption rate declines in the early 80s—but this did not have a negative effect on population growth/ 

“What about the other developing regions?”

Since 1965, there has not been a sustained downturn in petroleum consumption in the Middle East (ME) or Africa (AF), and, the regional population growth rate these

Figures 35 and 36 show the respective plots of population versus petroleum consumption rate for the ME and AF.  Table 18 shows the population change for the same periods discussed above for NA and EU in Table 15.


Table 18: Rates of regional annual population change for periods of increasing and decreasing petroleum production rates in Africa and the Middle East
Range
Petroleum consumption rate trend
AF Population change (mil/yr)
ME Population change (mil/yr)
1965-1979
increasing
10.1
2.27
1979-1983
increasing
14.6
3.88
1983-2006
increasing
17.3
3.68
2006-2009
increasing
22.1
4.29

There never has been a significant disruption in petroleum consumption rates for these regions and so these plots are not useful for testing the idea that a decline in consumption would result in a decline in population growth.  They do show clearly, however, that the population growth rate is increasing for both of these regions.

Summary and Lessons from the Regional Analysis

Well, if you have hung with me through this analysis this far, and have been paying attention, I think that you will agree that there is little to no support here for the notion that just because petroleum consumption rates go into decline, that we are likely to see an immediate decline in population, or, even neccessarily a decline in the population growth rate.  In Part 7 I said correlation does not prove correlation. I think that the regional analysis here demonstrates this point nicely: even though pouplation and petroleum consumption have been increasing over the same period there is little evidence to show that the total consumption for any of these regions was a cause of the population increase.

I found that the results for the former Soviet Union quite interesting: a 54% decrease in petroleum consumption rates over 9 years (6%/yr) is associated with a declining population growth rate, but even then, the population growth rate didn’t turn negative until five years into the consumption decline.  And, the population growth rate didn’t turn positive again in the last nine years when the petroleum consumption rate has been increasing.

Similarly, the four year decline in the petroleum consumption rate in North America (4%/yr), in the early 80s, or, the present three-year of decline in consumption (3%/yr for NA) is not associated with a decline in population growth rates during these periods. 

Europe’s population growth rate has been declining, but is still positive, and the decline in growth rate has occurred regardless of whether the petroleum consumption rate was on an upward or downward trend.  This is similar to the same trend over the past nine years in the former Soviet Union: population growth rates slowly declining. 

The smaller declines in petroleum consumption rates in South American and Asia Pacific in the early 80s appeared was also not associated with a decline in population growth rate for these regions. 

Finally, both population growth and petroleum consumption rates have been on upward trends in Africa and the Middle East.

In summary, my analysis for these several regions as well as the global data do not support the idea of there being an immediate causal link between the direction of change in total petroleum consumption rates and the direction of change in population.  In other words, I don’t find support for the idea that reaching and passing the point of peak oil production rates mean that there is going to be an immediate die off.

Therefore I feel comfortable rejecting my scenario represented in Figure 28 in Part 7, namely that a decline in global population is imminent as global petroleum production goes into decline, as predicted in Part 6 of this series. 

Rather, my scenario of continued global population growth such as shown in Figure 25, and along the lines of Cribb’s expectations, seems closer to the mark.

However, I still don’t think that the scenario depicted in Figure 25 tells the whole story—there is a point where total petroleum production, and hence consumption for these regions, and globally, will decline below a level that can support the food production system as we have come to know it. 

After reflecting on these results, I believe that it was just that the total levels of consumption in NA, EU, FS, SA, AP, AF and ME, during the downturns in petroleum consumption rates, were still probably more than  enough to support the food production system, and therefore, there was no famine or population decline.

Therefore, I propose a new hypothesis:
The population will continue to grow in these seven different regions of the world, at least until the per capita petroleum production/consumption drops below a certain critical level that is needed to support a petroleum-driven Green Revolution.  Once production per capita declines below that critical level, I expect to see a decline in the region’s population, in proportion to the per capita petroleum consumption rate decline. 

So just how much petroleum consumption per capita is needed to sustain the food production system as we know it?  I will attempt to answer this question in the ninth part of this series, and, use my findings to refine my prediction of how population will change in the face of declining petroleum production.  I hope that you will join me.

Tuesday, May 3, 2011

Part 7 The relationship between global population and global petroleum production

Based on my analysis of regional petroleum production trends presented in part 2 and part 3, I was able to make some predictions in part 6 about peak oil and total recoverable oil (Q∞), for the seven regions studied: (Middle East, ME; Former Soviet Union, FS; Africa, AF; South America, SA; Asia-Pacific, AP; Europe, EU and North America, NA), as well as global (WO) production, peak oil and Q∞.

Here in part 7, I examine the correlation between global population and petroleum consumption and consider the merits of two possible scenarios for population change in light of declining petroleum production.  

I want to make clear at the outset that I am neither advocating for or against population control.  It doesn’t really matter what I think, and, nothing I do or say will influence the outcome.  I am just watching for trends and relationships, and considering different scenarios, in the hopes that this information might help people better understand and prepare for the hard times that I believe are ahead.

If you have an emotional reaction to this analysis, you might be the kind of person who wouldn’t want to know if they have six months (or six years) to live.  I would want to know, but I understand that some would rather not. If you would rather not, then you may want to exit now.

....

I think that the wedding of population growth and petroleum production likely occurred with the Green Revolution in the 1960s and 70s.  The Green Revolution was at least portrayed as being  about the laudable goal of helping people in undeveloped countries avoid starvation by transferring to them the modern food production technologies used in developed countries.  This technology transfer included the use of pesticides, advanced irrigation techniques, petroleum-based synthetic nitrogen fertilizers and new seed varieties (requiring higher inputs of petrochemical to be most effective).  While being very effective at increasing food production, these modern techniques are also heavily dependent on petrochemicals, and hence a continuing supply of petroleum and petroleum products. 

This is the reason why some have argued that the world is now essentially Eating Fossil Fuels.  Indeed, even US house representative Barlett has stated the same:

We started out with about a billion people and now we have about 7 billion people almost literally eating oil and gas because of the enormous amounts of energy that go into producing food. Almost half the energy that goes into producing a bushel of corn comes from the natural gas that we use to produce the nitrogen fertilizer.  Roscoe Barlett R-MD, HEARING BEFORE THE SUBCOMMITTEE ON ENERGY AND AIR QUALITY, DECEMBER 7, 2005, Serial No. 109-41. 

If the global food supply has become dependent upon the availability of fossil fuels, and, the supply of those fossil fuels is declining, then it is easy to see why the global food supply could be in jeopardy.

Taking this further, if sustaining the present global population is only made possible by the petroleum-dependent technologies of the Green Revolution, then what happens to food production, and population growth, when petroleum production goes into terminal decline?  

My analysis in Parts 5 and 6 suggests that global petroleum exports and production are in decline now, with exports likely to hit zero in the next 20-25 years.  Can food production continue to expand, or even remain constant if there isn’t enough petroleum to expand or even sustain the Green revolution?  If food production growth stalls out, how can the global population continue to grow?

Jay Hanson’s die-off scenario

Hanson said in a 2008 interview that he used the term “die-off” and created his web-site of the same name in the 1990s because he saw a horrible future ahead, with 90% of the earth’s population dying an untimely death.  Hanson also see the economies of the world going into decline as they will be constrained by declining net useful energy (i.e., the ERoEI goes down).  Hanson expects that resource wars will occur to stave off the decline in standard of living in certain regions. Unless people change their ways (i.e., consumption declines), Hanson sees the world’s population declining at about the same rate as the rate of decline in the resources. 

If the world’s food supply is now tightly linked to the petroleum-dependent techniques of the Green Revolution, then petroleum would be a key one of those declining resources.  Therefore under this scenario, we can hypothesize that population should decline as petroleum consumption, and hence the food-supply, declines.

Julian Cribb’s feed 9-11 billion scenario

Cribb suggests that the world is at risk of a global food shortage by the mid-century that will cause massive famine (see e.g., Jim Puplava interview and U of Melbourne seminar).  Cribb believes that the world needs a Green Revolution 2.0 in order to feed the world’s population, which is estimated to reach 9-11 billion by 2050-2060. 

Cribb believes that the economies of developing countries will continue to grow and therefore global food demand will need to double as this additional 5 billion people, mostly in developing countries like China and India, demand more and higher quality food (that is, food with a higher protein content). 

My impression is that Cribb sees the previous Green Revolution of the 1960-70s as being fueled more by knowledge and technology transfer and less so by the petroleum inputs that were required to actually implement that knowledge and technology.

However, Cribb sees the coming inability to grow the food supply as being mainly due to resource depletion on several levels.  Oil certainly is one factor, but there is also the growing scarcity of fresh water, farm land being encroached by urban sprawl, overused soils being depleted of nutrients, declining fish stock and climate change.  Much of the produced food is inefficiently wasted (1/3 and 1/2 in developed and developing countries, respectively, according to Cribb).   There is also the worry that the agriculture and transportation sectors will lose petroleum to military uses, and, that this will further reduce the ability to produce and deliver food efficiently.  Many of these factors are linked and feed back on each other, Cribb says.

Cribbs sees the huge challenge facing farms is how to double the food supply with less water, less land, less petroleum, less petrochemical based fertilizers and pesticides, and less money being invested in new technologies.  He calls for a “change in behaviour by every person on the planet, especially in rich and urban societies.”  He calls for more funding for agricultural research and education.  Ending the huge amounts of waste in the current food production system would help and specifically the development of technologies more suited to smaller farm such as found in the developing world.   Cribb would also like to see a change in the diet of Americans and other developed countries away from protein towards a higher vegetable content.  Perhaps higher food prices would help achieve these goals, Cribb suggests.

In the absence of this doubling in the food supply, like Hanson, Cribb see famine, resources wars, “tidal waves” of refugees, and the collapse of governments in many countries.

Population decline now, population decline later, or infinite population growth?

I use Hanson’s and Cribb’s presentations to highlight two different scenarios that could occur over the next 50 years. 

On one hand, there could be a strong decline in population, a die off, as Hanson puts it, or famine, as Cribb puts it, as the vital resources needed for food production decline.  As petroleum is one of those vital resources, then as petroleum production declines, so too should the population decline.  Presumable the end point would be a world population at about the same level as it was in the pre-petroleum age.

One the other hand, perhaps we get Cribb’s 2.0 Green Revolution, and the world’s food supply is somehow doubled, even in the face of declining resources, to support a world population of 9-11 billion by the middle of the century. 

Cribb didn’t talk in his Puplava interview or his proper U of M presentation about what happens after the world’s population reaches 9-11 billion at mid-century.  However, in the Q&A period following the U of M presentation (~51 min into the audio presentation) the question was raised about the “blind acceptance” that the world actually had the ‘carrying capacity” for a population of 11 billion people, and if this was even something good to strive for. 

In response, Cribb finessed his answer, by agreeing with the questioner that food and population are intimately linked, that population was an “elephant in the room,” but that the discussing population was “a dangerous place to go.”  He argued that we have to find a way to manage the population down to some sustainable level.  Cribb pointed out that the sustainable population level will depend on the diet that people have, and, he hoped that managing down the population will be driven by the growing movement of women deciding to have less children.    

It is my impression that Cribb is hoping that if we can just manage the coming population boom to the mid-century, then the birth rate will naturally go down, and the population problem will go away on its own accord.

I think that Cribb’s hoped for Green Revolution 2.0 simply tries postpones the inevitable population decline—possibly with an even larger die off in the later half of the century—but perhaps without the resource wars. 

And if the world’s population were to continue to increase after mid-century, then what?   “Green Revolution 3.0” to support a world population of 15 billion by the end of the century, and so on, ad infinitum?   If you accept that we live on a finite planet with finite material resources and finite energy, then I think the notion infinite population growth can be rejected outright. 

What is less clear, however, is what the world’s population carrying capacity actually is, in view of declining resources, including declining petroleum. 

I wanted to see if the past annual data on population and petroleum production could put some numbers to two scenarios roughly matching Hanson's and Cribb's scenarios: population decline starting now, or,  continuation population growth (likely followed by a decline later on).

My continued population growth scenario

 Figure 25 shows (right axis) the cumulative population data for the seven regions that I have studied in previous parts of this series.  The data includes the US Census Bureau International Database of population statistics from 1950 to present (open black circles) as well as the Census bureau’s population projection to 2050 (solid black line). 

Also shown in Figure 25 (left axis) is the reported per capita global petroleum consumption rate (barrels per person year, b/py, open red circles), which I calculated from the per capita consumption rates for the seven regions, presented in Part 5 (Figure 18).  The data is from the BP Statistical Review, which reports back to 1965.  To this, I added per capita consumption rates from 1950-1964, which I obtained from another source.  I used global petroleum production rates reported for this period reported by the Earth Policy Institute, plus, the US census bureau’s reported population data to calculate per capita global consumption for the 1950-1964 time range.  

The predicted global per capita consumption from 2010-2050 (solid red line) is based on the composite of my predicted petroleum consumption rate trends for these seven regions from Part 6 (blue curve in Figure 20), divided by the US census bureau’s population projection. 

Figure 25 illustrates that the 4.2 billion increase in population occurring over the past sixty years (2.6 billion in 1950 to 6.8 billion in 2010) has occurred in the presence of expanding per capita petroleum consumption, peaking at 5.3 b/py in 1979, falling back to 4.3 b/py in 1983 and remaining in a narrow range since then.

If the US census bureau’s prediction of global population increase, and, my prediction of petroleum production rate decrease are both correct, then we should see a dramatic decline in per capita petroleum consumption over the next 40 years from 4.2 b/py in 2010, to only 0.5 b/py in 2050.

Not withstanding the other important factors affecting food production (water, soil, waste etc...) I think that this is roughly what would have to happen if Cribb’s scenario would come to pass.

My population decline now scenario

Figure 26 shows the relationship between global population and global petroleum production from 1950 to 2009.  There is a pretty strong linear correlation (solid blue line) between population and petroleum production.


It is bit harder to see, but there are also linear sub-trends within this data.

Figure 27 shows the same data as in Figure 26, except that I have added a line connecting the data points for adjacent years, and, I performed linear regression analysis for two different periods: 1950-1979 and 1982-2009.   

Table 13 summarizes the linear regression best fit slope, intercept and correlation coefficient.


Table 13: linear correlations between global population and petroleum production rate
Range
Slope (b / bbs per yr)
Intercept (b)
r2
1950-1979
0.082
2.38
0.98
1982-2009
0.215
0.26
0.98


Although correlation does not prove causation, what would these linear relationships imply if we assumed that increasing petroleum production (my assumed proxy for food production) was the cause of the population increase?  This does not appear to be too outrageous an assumption, given the suggestion that the petroleum-driven Green Revolution is what has expanded the global food supply and hence increase the carrying capacity of the earth, if only for a brief period until the oil runs out. 

Remember, this is just an assumed causal relationship made on my part, so that I can work some numbers up for this scenario.

From 1950-1979, the slope of 0.0816 billion people / billion barrels per year (b / bbs per yr), suggests that for every 1 bbs/yr increase in the petroleum production rate, the population increased by 82 million people.  But from 1982-2009, the slope of 0.215 b / bbs per yr suggests that the population increased by 215 million people for every 1 bbs/yr increase in production.   Why?  I speculate that this 2.6 times increase in the slope for the 1982-2009 time span, compared to 1950-79 time span, might be showing an increase in the efficiency of food production, perhaps due to a world-wide petroleum-driven Green Revolution. 

For the purposes of this scenario, I have assumed that the linear relationship for the 1982-2009 time span represents the world’s current dependence on petroleum production for population growth.  I will go a but further and assume that as petroleum production declines, as I predicted in part 6, the same linear relationship holds—but in reverse.  That is, for every 1 bbs per yr decline in the petroleum production rate, the population declines by 215 million.   Specifically, I used the slope and intercept for the 1982-2009 time span, presented in Table 13, to calculate the population as the predicted petroleum production rate declines from 2010 on. 

Figure 28 shows the result of this calculation, presented in a form analogous to Figure 25. 

The right axis shows the predicted steady population decline from 2010 to 2050 (solid black line)—a whooping decline of 5.5 billion people!   Of course a population decline mitigates the decline in per capita petroleum consumption (solid red line; left axis).  For instance, instead of per capita consumption declining to only 0.5 b/py in 2050 (Figure 25), in this scenario, per capita consumption is still 3.4 b/py by 2050—only about 20% lower than per capita consumption of 4.2 b/py in 2009.

I think that this is roughly what would happen if Hanson’s scenario to came to pass. 

Summary

For the continued population growth scenario represented by Figures 25 we are looking at a world population of 9.2 billion by 2050—an about 2.4 billion person increase over US census bureau estimates of 6.8 billion in 2010.  Can the estimate per capita petroleum consumption of 0.5 barrels per person per year by 2050 really by expected to sustain that level of population? I find this very hard to imagine.
For my population decline now scenario, the decline really would have to be quite severe just to keep per capita consumption at 3.4 b/py by 2050.  Only 1.5 billion people by 2050 means shedding 5.5 billion people over the next 40 years, or about 137 million people per year.  One hundred and thirty seven thousand people per year is many, many, untimely deaths.  That’s way more than the total number of military and civilian deaths in  WWI and WWII combined every year for 40 years in a row.  I also find this very hard to imagine. 

Is there anything from past relationships between population and petroleum consumption that gives some insight into which of these two scenarios is more likely?  I think there is, particularly in the regional data.

Join me next time when I will present my arguments as to which of these two scenarios I think is the more likely one to occur.